Advanced Network Analysis
Intro to Spatial Statistics
Olga Chyzh [www.olgachyzh.com]
Dependence in Observational Data
Individuals are nested in social networks
- Individual decisions are influenced by their friends.
Provinces are surrounded by other provinces
- Provinces mimic one another's policies
Country-level outcomes are often a result of negotiations with other countries:
- Economic or environmental policies
Three Mechanisms for Spatial Dependence
Common exposure---similarity in outcomes is driven by an exogenous factor that affects nearby units (the effect of earthquakes on housing prices)
Homophily---similarity in outcomes is endogenous, units are similar because they self-select into the same outcome (e.g., partisan geo-sorting)
Diffusion---nearby units affect each other through learning, imitation, etc (e.g., policy diffusion)
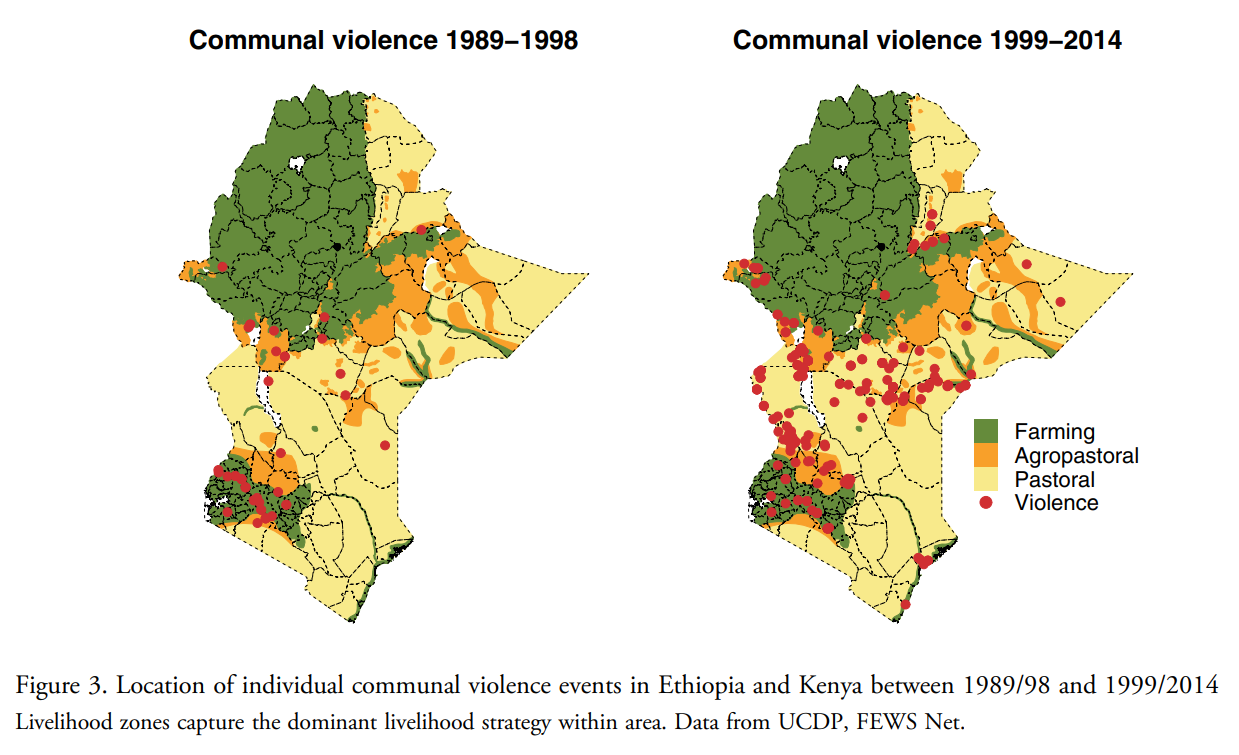
Source: van Weezel S. "On climate and conflict: Precipitation decline and communal conflict in Ethiopia and Kenya." Journal of Peace Research. 2019;56(4):514--528.
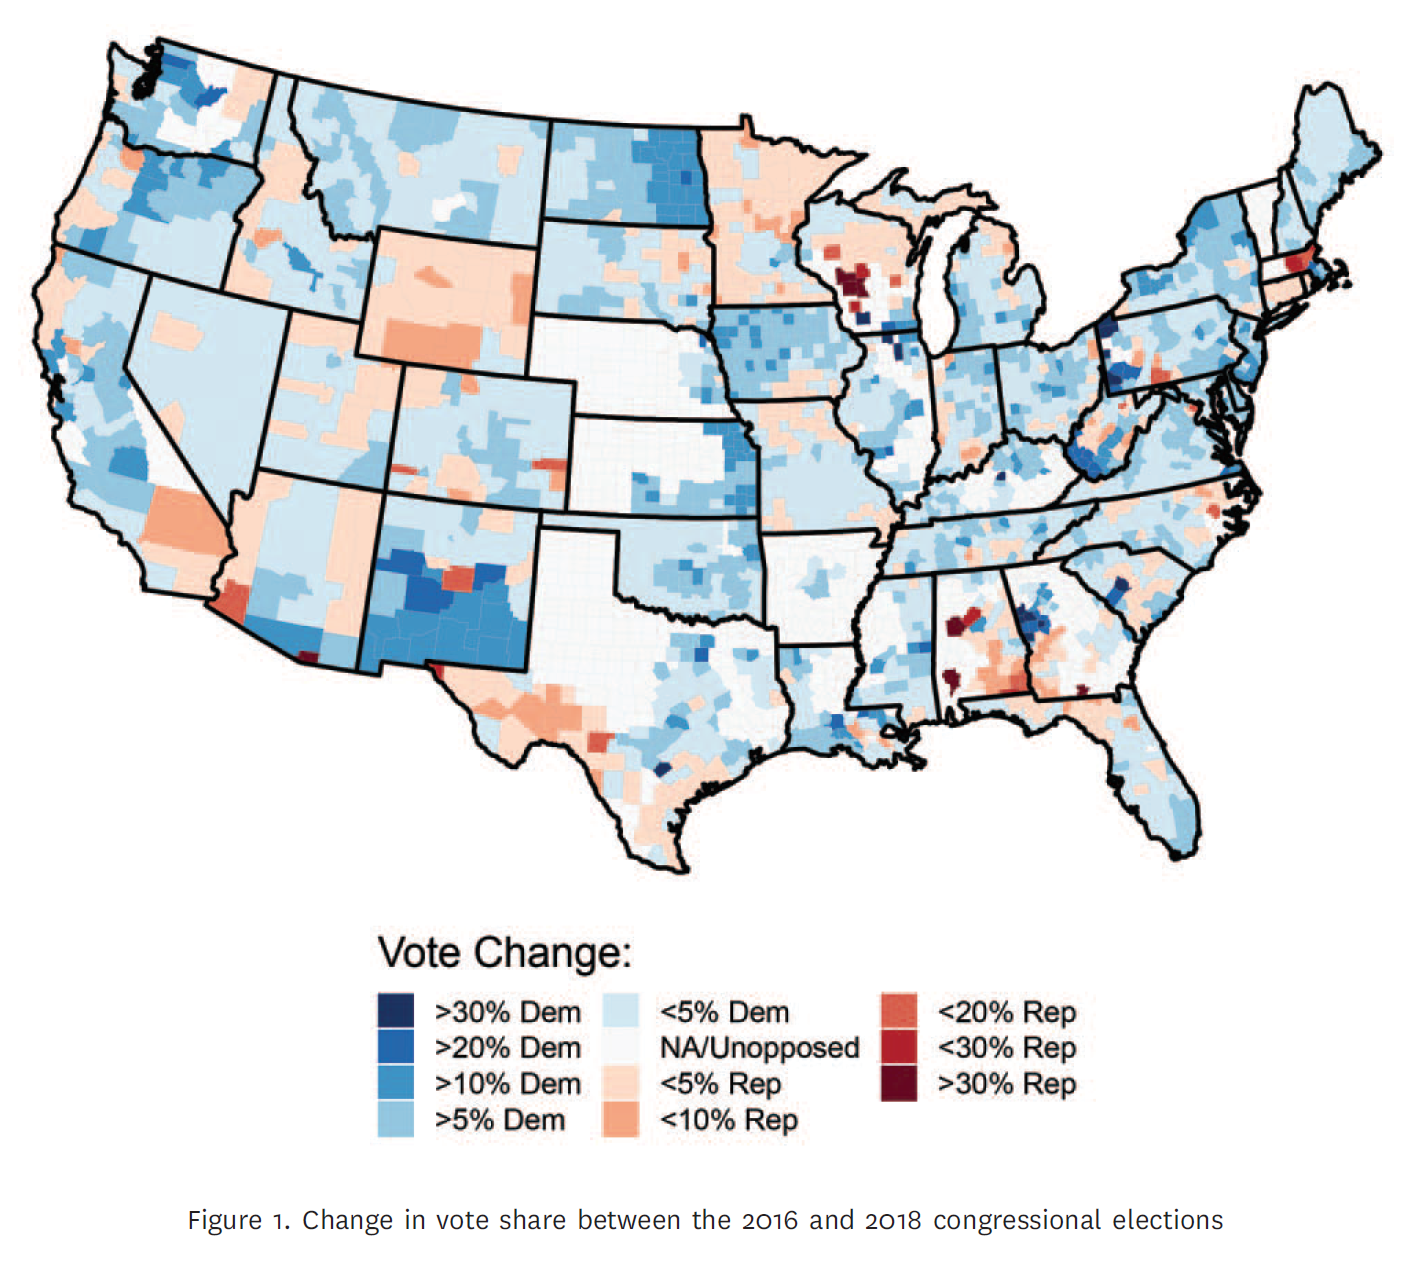
Source: Chyzh, Olga V. and R. Urbatsch. 2021. "Bean Counters: The Effect of Soy Tariffs on Change in Republican Vote Share Between the 2016 and 2018 Elections."Journal of Politics 83 (1): 415--419.
What Explains Variation in Covid-19 Cases?
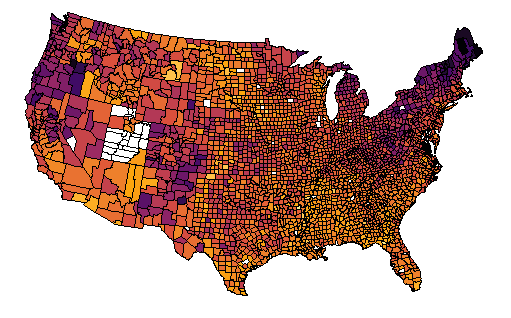
Common Exposure
Neighboring counties have similar Covid-19 rates because of their underlying similarities, e.g. demographics, political ideology (anti-mask sentiment), etc.
Covid19 cases/capi=β0+β1Urbani+β2Trump16i+β3medinci+ui,
Homophily: Spatial X
Neighboring units tend to converge on outcomes because the causal variables (anti-vaccine sentiments) cluster by neighborhood locations (partisan geo-sorting).
Covid19 cases/capi=β0+β1Urbani+β2Trump16i+β3medinci+ρN∑j≠iwij Trump16j+ui, where ρ is the estimation parameter for spatial dependence, and wij measures whether i and j are neighbors.
This is a spatial-X regression.
N∑j≠iwij Trump16j is a spatially lagged independent variable measuring the average Trump support in neighboring counties.
The coefficient ρ is a measure of spatial homophily.
Contiguity Matrix W
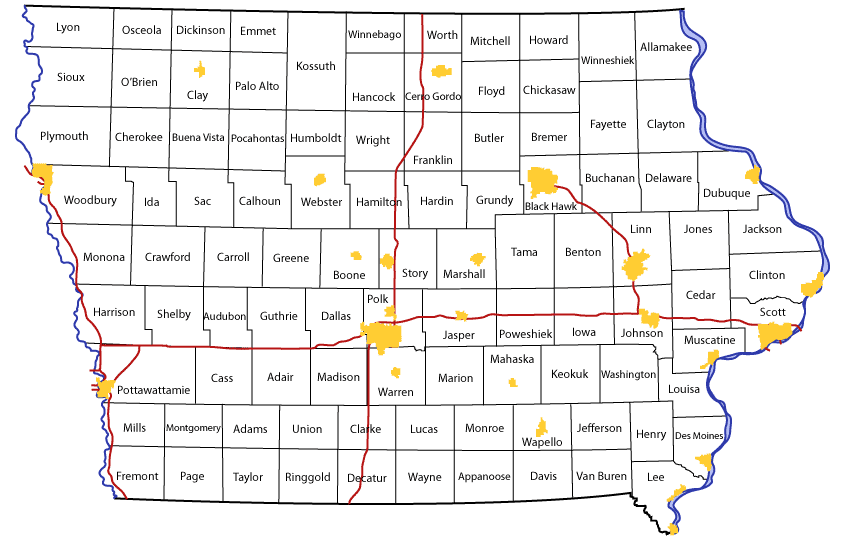
Contiguity Matrix W
## Benton Linn Jones Iowa Johnson Cedar## Benton 0 1 0 1 0 0## Linn 1 0 1 0 1 1## Jones 0 1 0 0 0 1## Iowa 1 0 0 0 1 0## Johnson 0 1 0 1 0 1## Cedar 0 1 1 0 1 0Row Standardized W
Divide by the row sum, so that each neighbor's influence decreases with the total number of neighbors.
## Benton Linn Jones Iowa Johnson Cedar## Benton 0.00 0.50 0.00 0.50 0.00 0.00## Linn 0.25 0.00 0.25 0.00 0.25 0.25## Jones 0.00 0.50 0.00 0.00 0.00 0.50## Iowa 0.50 0.00 0.00 0.00 0.50 0.00## Johnson 0.00 0.33 0.00 0.33 0.00 0.33## Cedar 0.00 0.33 0.33 0.00 0.33 0.00Diffusion: Spatial Y
Covid19 cases/capi=β0+β1Urbani+β2Trump16i+β3medinci+ρN∑j≠iwij Covid19 cases/capj+ui, where ρ is the estimation parameter for spatial dependence, and wij measures whether i and j are neighbors.
This is a spatial-Y regression.
N∑j≠iwij Covid19 cases/capj is a spatially lagged dependent variable measuring the average number of Covid-19 cases in neighboring counties.
The coefficient ρ is a measure of spatial dependence.
Spatial Y Model
y=ρWy+Xββ+ϵϵ,
y the dependent variable, is an N x 1 vector of cross sections stacked by period;
ρ is the spatial coefficient;
W is an N x N spatial-weighting matrix;
X contains N observations on k independent variables
ββ is a k x 1 vector of coefficients;
ϵϵ is an N by 1 vector of stochastic components.
Spatial Y Model
⎡⎢ ⎢ ⎢ ⎢ ⎢ ⎢ ⎢⎣y1y2y3⋮yN⎤⎥ ⎥ ⎥ ⎥ ⎥ ⎥ ⎥⎦=ρ⎡⎢ ⎢ ⎢ ⎢ ⎢ ⎢ ⎢⎣0W12W13⋯W1NW210W23⋯W2NW31W320⋯W3N⋮⋱⋮⋱⋮WN1WN2WN3⋯0⎤⎥ ⎥ ⎥ ⎥ ⎥ ⎥ ⎥⎦+⎡⎢ ⎢ ⎢ ⎢ ⎢⎣x11x12⋯x1kx21x22⋯x2k⋮⋮⋱⋮xN1xN2⋯xNk⎤⎥ ⎥ ⎥ ⎥ ⎥⎦⎡⎢ ⎢ ⎢ ⎢⎣β1β2⋮βk⎤⎥ ⎥ ⎥ ⎥⎦+⎡⎢ ⎢ ⎢ ⎢⎣ϵ1ϵ2⋮ϵN⎤⎥ ⎥ ⎥ ⎥⎦
Spatial Lag Model
y=ρWy+Xββ+ϵϵ,
By re-arranging, can isolate y on the left-hand side:
y=[ININ−ρWN]−1{Xββ+ϵϵ}
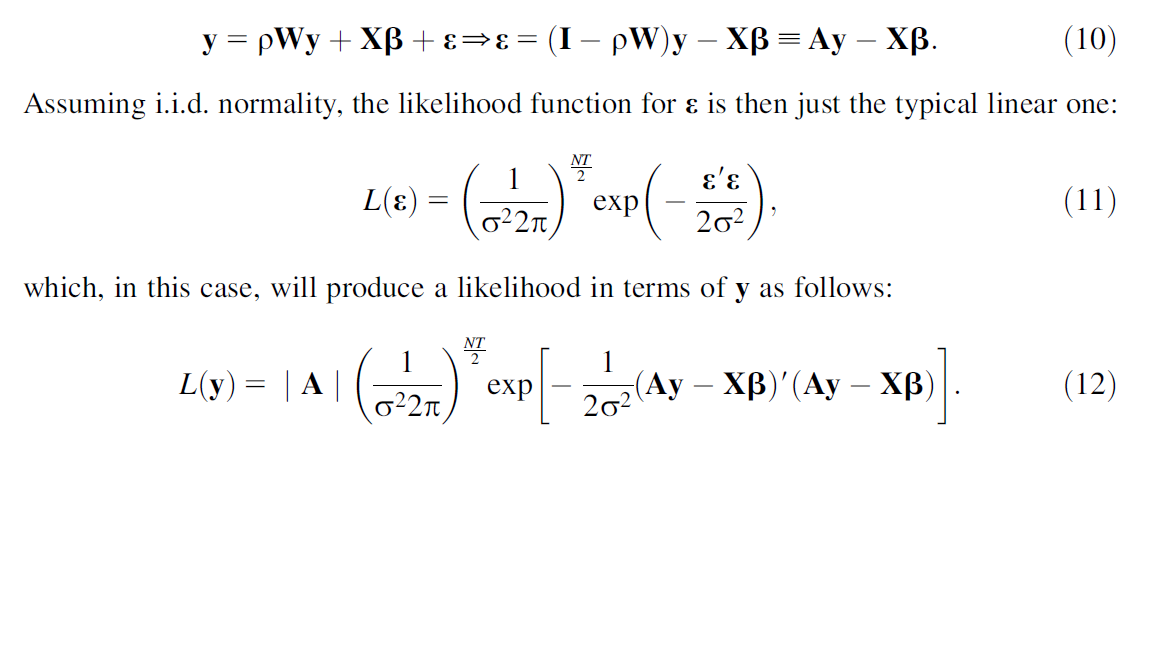
Likelihood
Other Types of Space
Ideology
International trade
Alliances
Other examples?
Lab
Example: Spatial X
mydata<-read.csv("./data/covid_data.csv", header=TRUE) mydata$trumpmarg[is.na(mydata$trumpmarg)]<-0contigmat<-read.table("data/contigmat.txt") |> as.matrix()contigmat1<-contigmat/apply(contigmat,1,sum) #row-standardizemydata$W_trumpmarg<-contigmat1%*%mydata$trumpmargm1<-lm(data=mydata, cases_pc~urb2010+trumpmarg+medinc1317)m2<-lm(data=mydata, cases_pc~urb2010+trumpmarg+medinc1317+W_trumpmarg)Spatial Regression
library(spdep)library(spatialreg)contigmat<-read.table("./data/contigmat.txt") contigmat<-as.matrix(contigmat)W1<-mat2listw(contigmat, row.names = NULL, style="W", zero.policy = TRUE)summary(W1$neighbours)W2<-nb2listw(W1$neighbours, glist=NULL, style="W", zero.policy=TRUE)m3 <- lagsarlm(data=mydata, cases_pc~log(totpop1317)+urb2010+trumpmarg+medinc1317, W2, zero.policy=TRUE)summary(m3)saveRDS(m3,"m3.RDS")Interpretation
Set up a hypothetical scenario:
- Expected change in Covid-19 cases that would result from increasing urbanization in Johnson county, IA
names<-c("benton","cedar","iowa","johnson","jones","linn")mymat<-matrix(c(0,0,1,0,0,1, 0,0,0,1,1,1, 1,0,0,1,0,0, 0,1,1,0,0,1, 0,1,0,0,0,1, 1,1,0,1,1,0),nrow=6,ncol=6)dimnames(mymat)<-list(names,names)mymat<-round(mymat/apply(mymat,1,sum),2)d<-dplyr::filter(mydata, state=="IA" & county %in% names)Set up A Comparison by Shocking One of the Units on X
m3<- readRDS("m3.RDS")I<- diag(6)X0<-as.matrix(cbind(1,log(d$totpop1317), d$urb2010, d$trumpmarg, d$medinc1317))urb<-d$urb2010urb[4]<-1X1<-as.matrix(cbind(1,log(d$totpop1317), urb, d$trumpmarg, d$medinc1317))A<-solve(I-coef(m3)[1]*mymat)mycoef<-as.matrix(coef(m3))Yhat0<- A%*%(X0%*%mycoef) #may need to remove first element of mycoeff[-1]; keep this for knitting (RDS works different)Yhat1<- A%*%(X1%*%mycoef) #may need to remove first element of mycoeff[-1]Y_ch<-Yhat1-Yhat0sim<- cbind.data.frame(names,Y_ch)Visualize the Effect

Your Turn
Suppose you want to test whether variable votech (the change in Republican vote share between the 2016 and 2018 Congressional election) is spatially clustered.
Calculate a measure of the average change in Republican vote share in neighboring states.
Estimate a model of votech as a function of urb2010, medinc1317, perc_HS_GED, perclatino1317 and trumpmarg.
Estimate the same model plus a the average change in Republican vote share in neighboring states.
Making Maps
library(tidyverse)library(mapproj)library(maps)library(mapdata)states <- map_data("state")head(states)## long lat group order region subregion## 1 -87.46201 30.38968 1 1 alabama <NA>## 2 -87.48493 30.37249 1 2 alabama <NA>## 3 -87.52503 30.37249 1 3 alabama <NA>## 4 -87.53076 30.33239 1 4 alabama <NA>## 5 -87.57087 30.32665 1 5 alabama <NA>## 6 -87.58806 30.32665 1 6 alabama <NA>What You Need
Latitude/longitude points for all map boundaries
Need to know to which boundary/state lat/long points belong
Need to know the order to connect points within each group
A Basic (Rather Hideous) Map
library(ggplot2)ggplot() + geom_path(data=states, aes(x=long, y=lat, group=group),color="black", size=.5)
A Bit Nicer of a Map
#Set theme options:theme_set(theme_grey() + theme(axis.text=element_blank(), axis.ticks=element_blank(), axis.title.x=element_blank(), axis.title.y=element_blank(), panel.grid.major = element_blank(), panel.grid.minor = element_blank(), panel.border = element_blank(), panel.background = element_blank(), legend.position="none"))ggplot() + geom_path(data=states, aes(x=long, y=lat, group=group),color="black", size=.5)+ coord_map()Polygon instead of Path
ggplot() + geom_polygon(data=states, aes(x=long, y=lat, group=group),color="black", size=.5)+ coord_map()
Incorporate Information About States
Add other geographic information (e.g., counties) by adding geometric layers to the plot
Add non-geographic information by altering the fill color for each state
Use geom = "polygon" to treat states as solid shapes to add color
Incorporate numeric information using color shade or intensity
Incorporate categorical informaion using color hue
Categorical Information Using Hue
If a categorical variable is assigned as the fill color then ggplot will assign different hues for each category.
Let’s load in a state regions dataset:
statereg<- read.csv("./data/statereg.csv")head(statereg)## State StateGroups## 1 california West## 2 nevada West## 3 oregon West## 4 washington West## 5 idaho West## 6 montana WestJoin the Data
states.class.map <- left_join(states, statereg, by = c("region" = "State"))head(states.class.map)## long lat group order region subregion StateGroups## 1 -87.46201 30.38968 1 1 alabama <NA> South## 2 -87.48493 30.37249 1 2 alabama <NA> South## 3 -87.52503 30.37249 1 3 alabama <NA> South## 4 -87.53076 30.33239 1 4 alabama <NA> South## 5 -87.57087 30.32665 1 5 alabama <NA> South## 6 -87.58806 30.32665 1 6 alabama <NA> SouthPlot the Regions
ggplot() + geom_polygon(data=states.class.map, aes(x=long, y=lat, group=group, fill = StateGroups), colour = I("black"))+ coord_map()+theme(legend.position="bottom")
Your Turn
Use color to show the expected change in Covid-19 cases that result from increasing urbanization in Johnson county, IA on a map.
Your Turn (Advanced)
- Read in the animal.csv data:
animal <- read.csv("./data/animal.csv")- Plot the location of animal sightings on a map of the region
- On this plot, try to color points by class of animal and/or status of animal
- Advanced: Could we indicate time somehow?