Network Analysis
Models for Binary DVs
Olga Chyzh [www.olgachyzh.com]
Agenda
Logistic Regression
Odds vs. Probabilities
Maximum Likelihood Estimation
Probit
Why Logit?
An alternative to the linear probability model
Constraints the range of \(\hat{y}\) to plausible values (between 0 and 1).
Accounts for error heteroskedasticity in estimating standard errors.
Binary Dependent Variable
Consider the following model:
$$ Heart Attack = \beta_0+ \beta_1 Aspirin+u $$
Problem: Heart Attack takes on binary values of 0 (no heart attack) and 1 (heart attack)
Goal: rather than fitting a line, fit a curve such that the possible values are contrained between 0 and 1.
Goal

Need to Transform Y
- While Heart Attack is binary, the odds of having a heart attack, \(O\), are continuous and take on values between 0 and \(+\infty\), \(0<O<+\infty\)
Calculating Odds
| Heart Attk | No Heart Attk | Total | |
|---|---|---|---|
| Aspirin | 104 | 10933 | 11037 |
| Placebo | 189 | 10845 | 11034 |
| Total | 293 | 21778 | 22071 |
$$O(HA|Aspirin)=\frac{104}{10933}=0.0095$$ $$O(HA|\neg Aspirin)=\frac{189}{10845}=0.0174$$
Need to Transform Y
Even better, the log(odds of heart attack) are also continuous and take on values between \(-\infty\) and \(+\infty\).
If we transform our DV from Heart Attack to log(Odds of Heart Attack), we can use OLS to estimate it, then apply a reverse transformation to interpret the results:
$$ log(Odds\; of\; HA) = \beta_0+ \beta_1 Aspirin $$
Calculating Odds
Can also calculate odds from probabilities: $$P(HA|Aspirin)=\frac{104}{11037}=0.0094$$ $$P(HA|\neg Aspirin)=\frac{189}{11034}=0.0171$$
$$ \begin{align} O(HA|Aspirin)&=\frac{P(HA|Aspirin)}{P(\neg HA| Aspirin)}=\frac{P(HA|Aspirin)}{1-P(HA|Aspirin)}\&=\frac{0.0094}{1-0.0094}=0.0095 \end{align} $$
And probabilities from odds:
$$ P(HA|Aspirin)=\frac{O(HA|Aspirin)}{1+O(HA|Aspirin)}=\frac{0.0095}{1+0.0095}=0.0094 $$
- This is the formula to convert the results of the \(logged(odds)\) regression to probabilities.
Logistic Regression
$$\begin{align} &\log(O(HA|Asp)) =\log\left(\frac{P(HA|Asp)}{1-P(HA|Asp)}\right)= \beta_0+ \beta_1 Aspirin\\ &O(HA|Asp) = \frac{P(HA|Asp)}{1-P(HA|Asp)}=e^{(\beta_0+ \beta_1 Aspirin)}\\ &P(HA|Asp)=\frac{e^{(\beta_0+ \beta_1 Aspirin)}}{1+e^{(\beta_0+ \beta_1 Aspirin)}}\\ &P(\neg HA|Asp)=1-\frac{e^{(\beta_0+ \beta_1 Aspirin)}}{1+e^{(\beta_0+ \beta_1 Aspirin)}} \end{align}$$ Or, in general terms:
$$ \begin{align} &P(Y=1|X)=\frac{e^{(\beta_0+ \beta_1 X)}}{1+e^{(\beta_0+ \beta_1 X)}}\ &P(Y=0|X)=1-\frac{e^{(\beta_0+ \beta_1 X)}}{1+e^{(\beta_0+ \beta_1 X)}} \end{align} $$
Example 2: Effect of GRE Scores on Admission
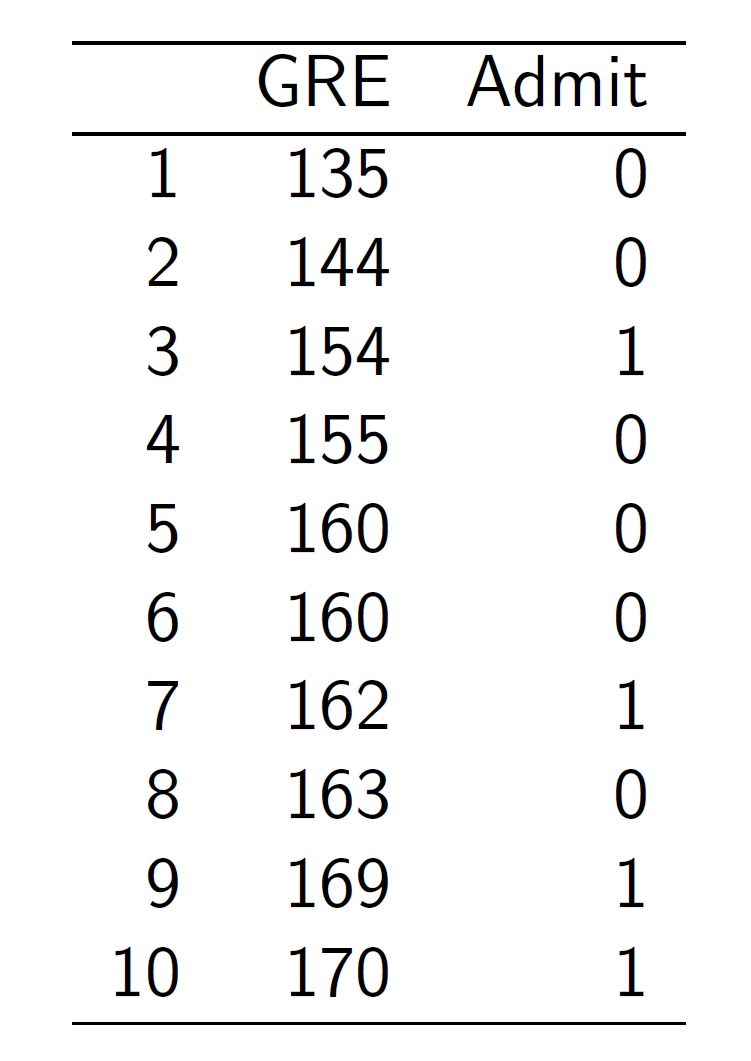
Effect of GRE Scores on Admission
Suppose we want to estimate the following model:
$$ \text{P(Admit=1|GRE)}=logit(\alpha+\beta_1\text{GRE}) $$ Problem: how can we find \(\alpha\) and \(\beta_1\)?
Maximum Likelihood Estimation
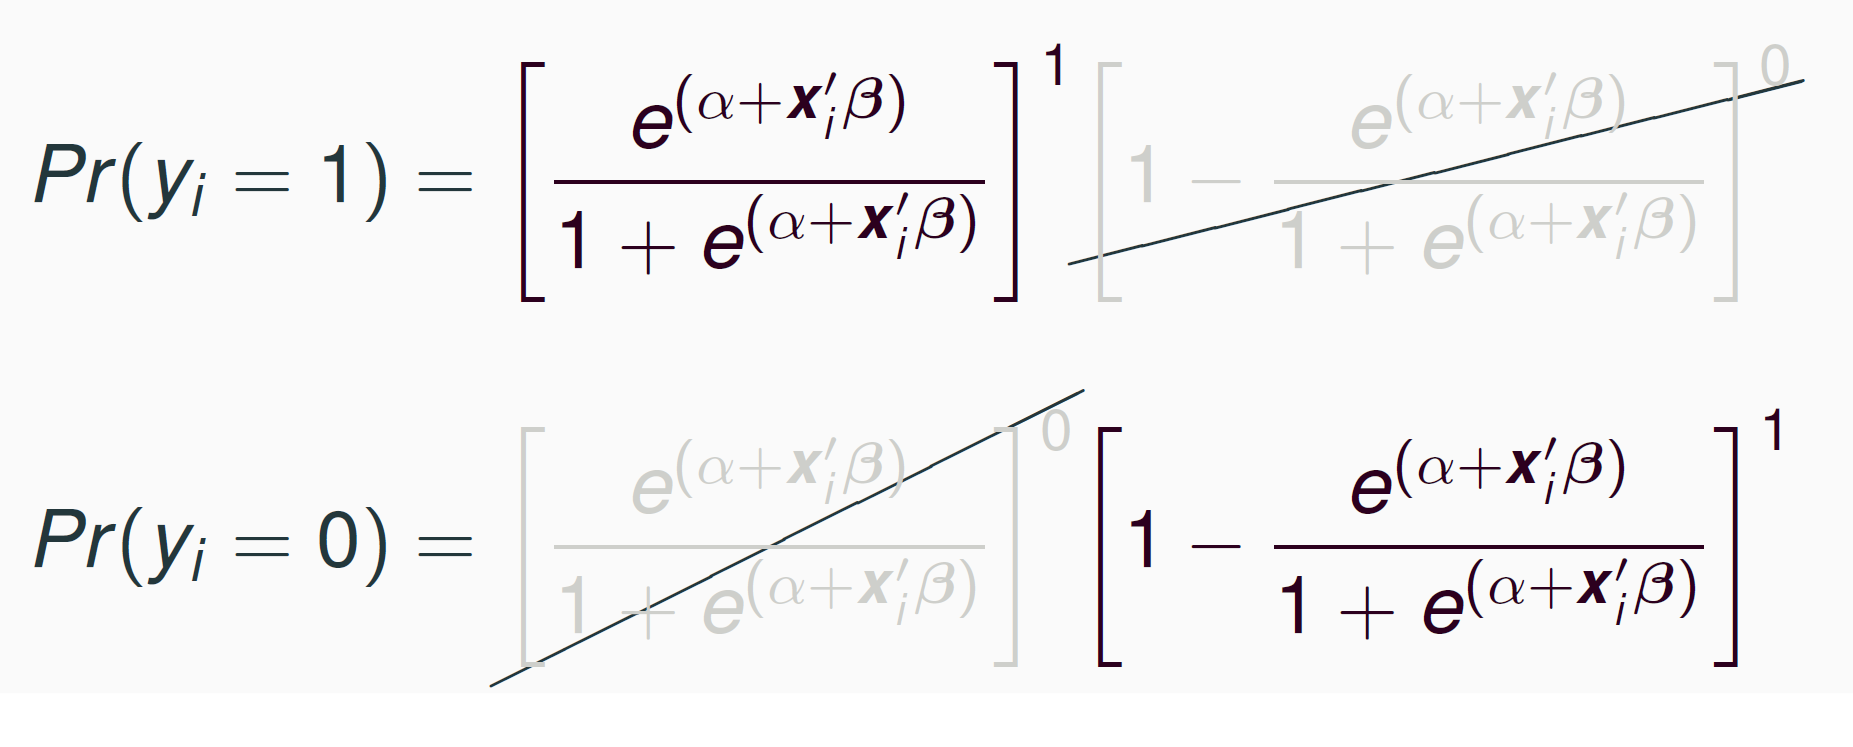
[1] Write out the probability for each observation (called "likelihood"):
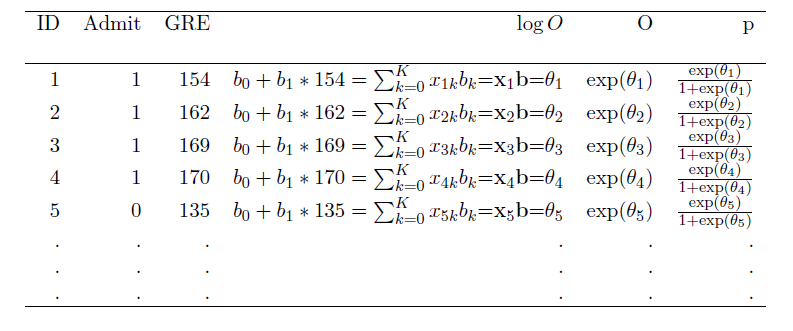
[2] The joint probability (called "the joint likelihood") of all the probabilities (assuming independent observations) is the product of these probabilities:
$$ \prod{p_i^{y_i}(1-p_i)^{(1-y_i)}} $$
Likelihood


Maximum Likelihood Estimation
$$ \prod{p_i^{y_i}(1-p_i)^{(1-y_i)}}, $$ where \(p_i=\frac{e^{(\beta_0+ \beta_1 x_i)}}{1+e^{(\beta_0+ \beta_1 x_i)}},\)
Unlike with OLS, where we calculated \(\beta_k\) using the formulae we derived, we find \(\beta_k\) using numerical optimization (essentially by guessing).
To help computer optimizers (the product of \(p_i\) can become very small), we take advantage of the fact that the maximum of the product and the logged product are the same, and take the log of the joint likelihood:
$$ log(\prod{p_i^{y_i}(1-p_i)^{(1-y_i)}})=\sum{y_ilog(p_i)}+\sum{(1-y_i)log(1-p_i)}, $$
A Latent Variable Model for Binary Variables
Your Turn
Using R, the z-table, or Google, find the p-values that correspond to the following z-scores: -3,-2.5, -2, -1.5, -1, -0.5, 0, 0.5, 1, 1.5, 2, 2.5, 3. What do these values tell you? Use these values to sketch (yes, on paper with a pencil!) the cumulative density function for the normal distribution.
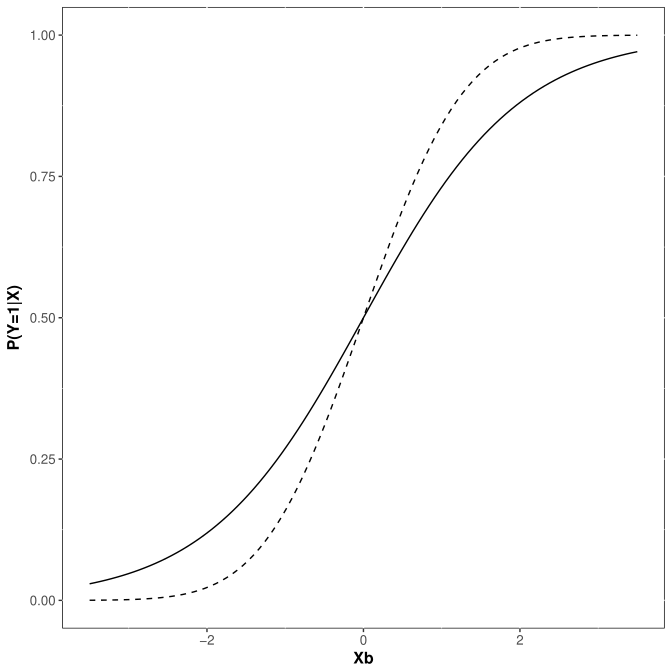
Normal CDF
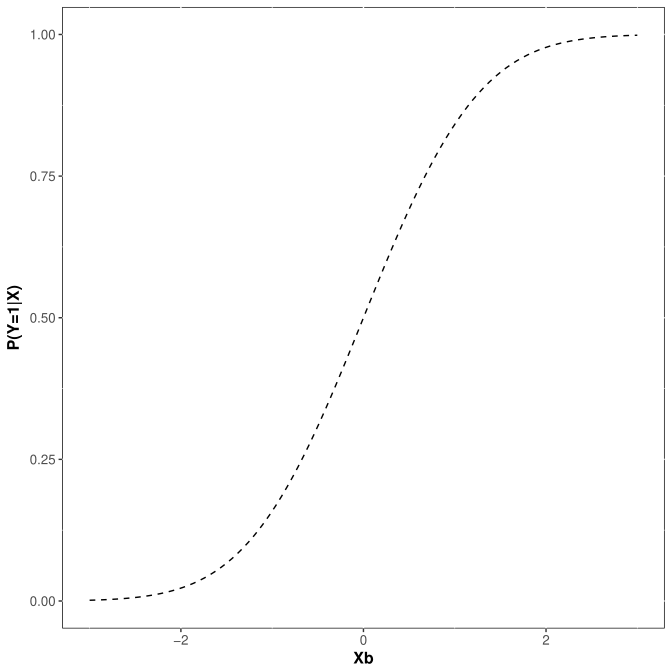
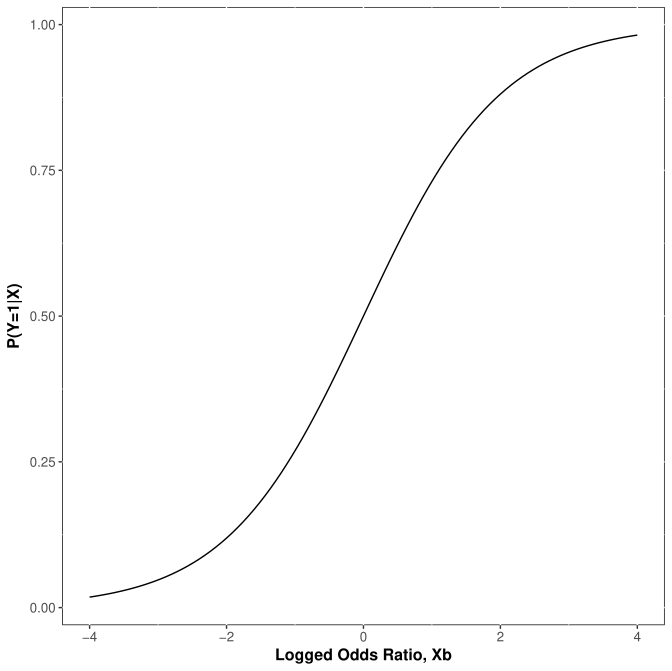
Logistic CDF
Both
Another Way to Think of BRMs
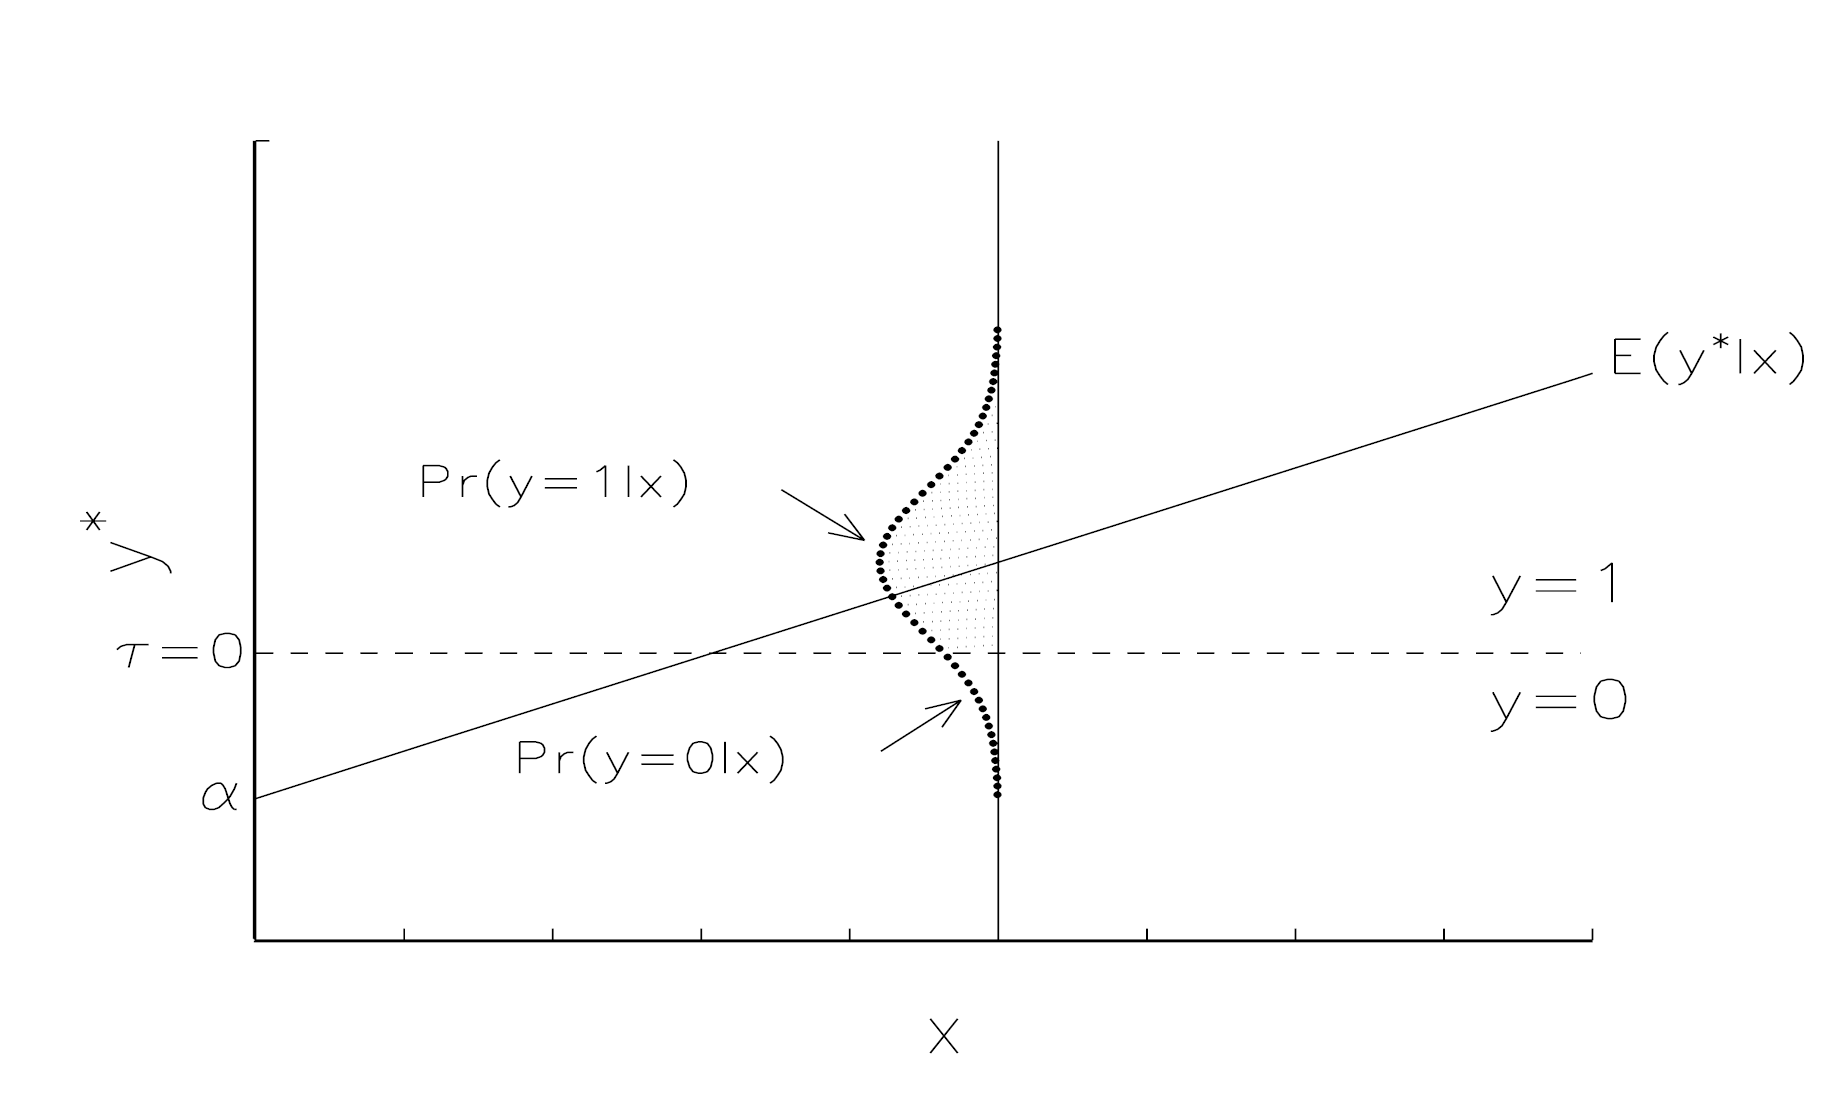
Suppose there is an unobserved or latent variable \(y^*\) ranging from \(-\infty\) to \(+\infty\) that generates the observed \(y\).
Observations with larger values of \(y^*\) are observed as \(y=1\), while those with smaller values of \(y^*\) are observed as \(y=0\).
- E. g., consider college admissions decisions or civil wars
Assume that the latent \(y^*\) is linearly related to the observed \(x\)s through the structural model:
$$ y^*_i=\pmb{x}_i\pmb{\beta}+\epsilon_i $$
A Latent Variable Model
The latent \(y^*\) is linked to the observed binary variable \(y\) by the measurement equation:
$$\begin{equation} y_i=\begin{cases}{1 \; \text{ if } y^*_i>\tau\\ 0 \; \text{ if } y^*_i\leq \tau} \end{cases} \end{equation}$$
where \(\tau\) is the threshold or cutpoint. Assume \(\tau=0\).
Since \(y^*\) is unobserved, we use ML estimation.
Assume \(E(\epsilon| \textbf{x})=0\) and that the error is normally distributed with variance \(Var(\epsilon| \textbf{x})=1\).
- This assumption is arbitrary, but it is necessary only for estimation. The final results do not depend on it.
A Latent Variable Model
A Latent Variable Model
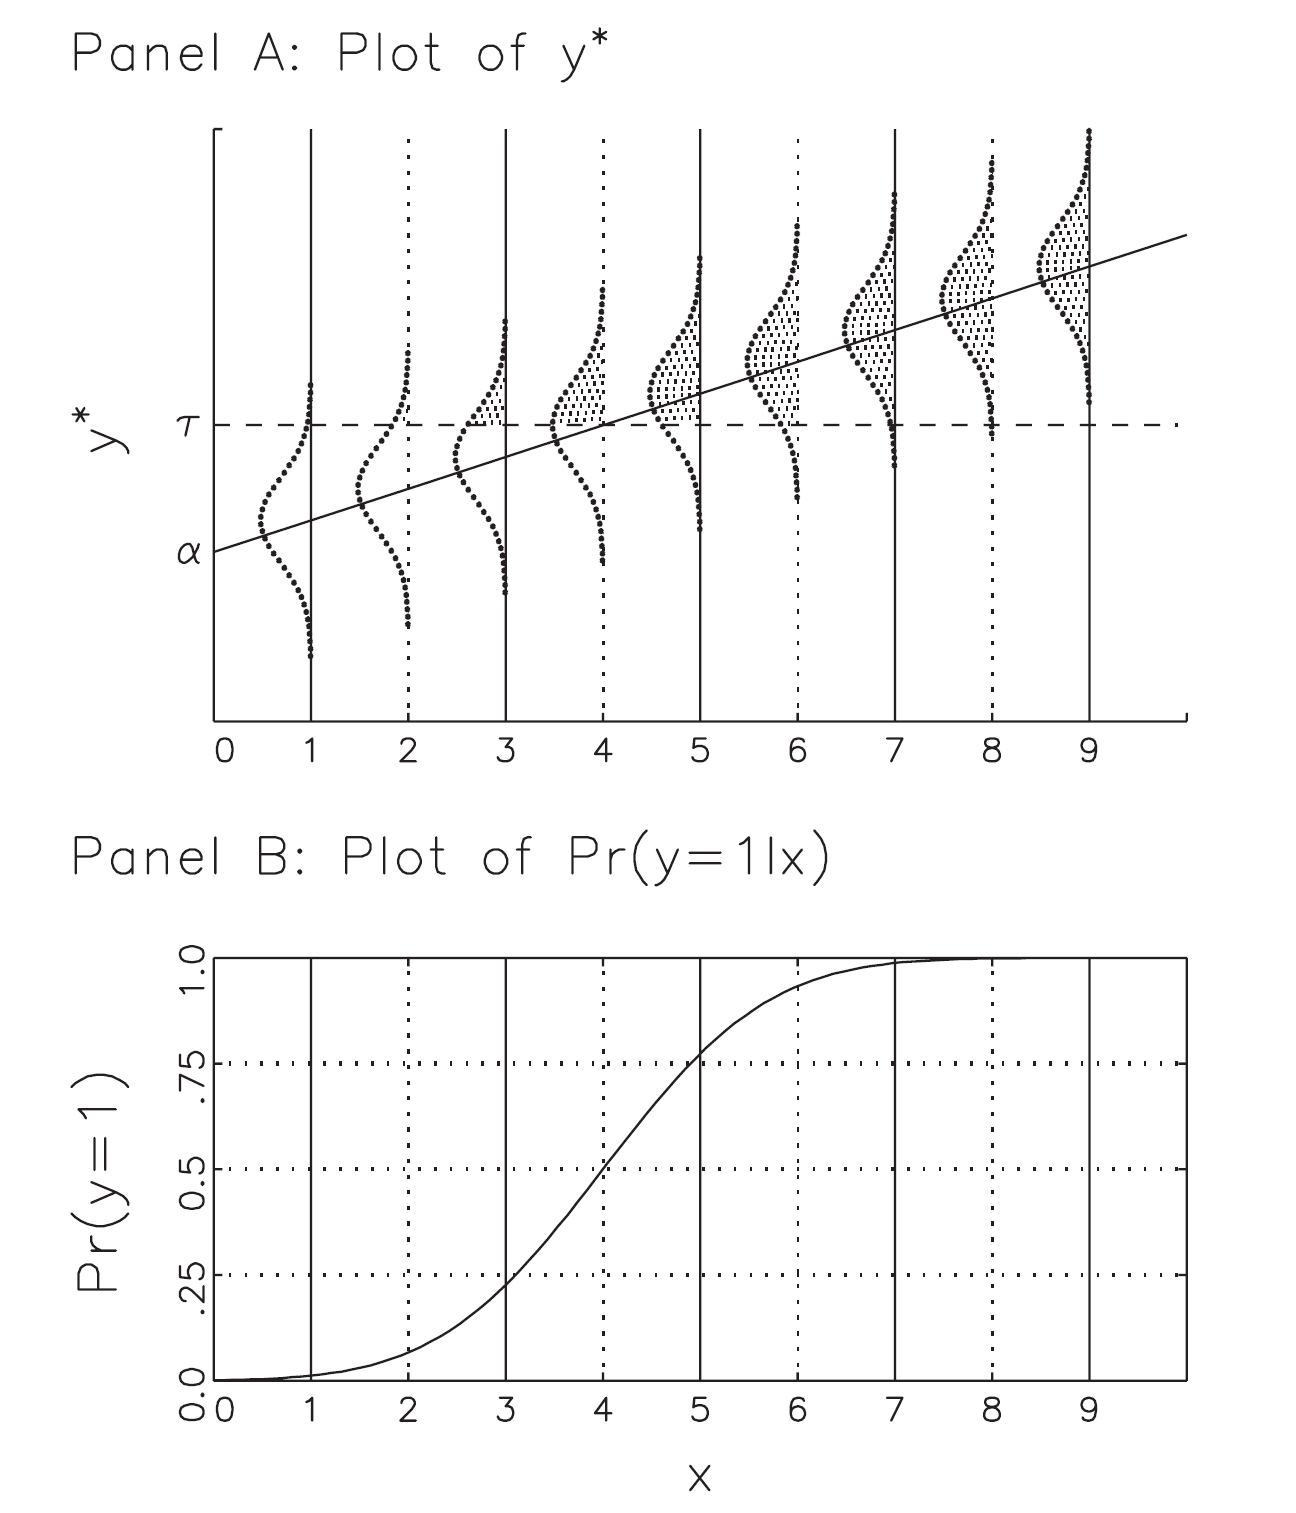
On average, we observe \(y=1\) when \(E(y^*| x)> 0\) and \(y=0\) otherwise.
- Even when \(E(y^*| x)> 0\), it is possible to observe \(y=0\), especially is the error is large and negative.
Since \(y=1\) when \(y^*>0\):
$$\begin{align} P(y=1| \textbf{x})&= P(y^*>0| \textbf{x})\\&=P(\textbf{x}\pmb{\beta}+\epsilon>0 \;|\;\textbf{x})\\ &=P(\epsilon>-\textbf{x}\pmb{\beta}\;|\;\textbf{x})\\ &=P(\epsilon\leq \textbf{x}\pmb{\beta}\;|\;\textbf{x})\\ &=\Phi(\textbf{x}\pmb{\beta}) \end{align}$$
Note that we must change the direction of the inequality in step 4, because the normal cdf expresses the probability of a variable being less than some value.
Note that \(\Phi(\textbf{x}\pmb{\beta})\) stands for the normal cdf.
Congratulations, we just derived a probit regression.
Plot of \(y^*\) and P(y=1| x) in the BRM
Probit Likelihood
Define \(p_i\) as the probability of observing whatever value of \(y\) was actually observed for a given observation:
$$\begin{equation} p_i=\begin{cases}{P(y=1\;|\;\textbf{x}_i) \; \text{ if } y_i=1 \text{ is observed}\\ 1-P(y=1\;|\;\textbf{x}_i) \; \text{ if } y_i=0 \text{ is observed}} \end{cases} \end{equation}$$
Then, as before, the likelihood is the product of these probabilities:
$$\begin{align} L(\pmb{\beta}| \pmb{y, X})&=\prod\limits_{i=1}^N{p_i} \\ &=\prod\limits_{y=1}{P(y=1\;|\;\textbf{x}_i)}\prod\limits_{y=0}{1-P(y=1\;|\;\textbf{x}_i)}\\ &=\prod\limits_{y=1}\Phi(\pmb{x}_i\pmb{\beta})\prod\limits_{y=0}[1-\Phi(\pmb{x}_i\pmb{\beta})] \end{align}$$
Log-Likelihood
Taking a log of the likelihood gives:
$$\ln{L}(\pmb{\beta| y, X})=\sum\limits_{y=1}ln\Phi(\pmb{x}_i\pmb{\beta})+\sum\limits_{y=}ln[1-\Phi(\pmb{x}_i\pmb{\beta})]$$
Amemiya (1985, 273-4) proves that under plausible conditions, the likelihood function is globally concave which ensures the uniqueness of ML estimates.
These estimates are consistent, asymptotically normal, and asymptotically efficient.
Lab: Maximum Likelihood Estimation
Effect of GRE Scores on Admission
Suppose we want to estimate the following model:
$$\begin{equation} \text{Admit}=logit(\alpha+\beta_1\text{GRE}+\beta_2\text{GPA}+\beta_3\text{Rank2}\\ +\beta_4\text{Rank3}+\beta_5\text{Rank4}) \end{equation}$$
Why did we omit Rank1?
The data are available at "https://stats.idre.ucla.edu/stat/data/binary.csv"
Maximum Likelihood Estimation (by hand)
mydata <- read.csv("https://stats.idre.ucla.edu/stat/data/binary.csv")all<- NULLy<- mydata$admitx<-mydata$grealpha<- 0 #we don't know so we'll try different guessesbeta<- 0log_odds<- alpha +beta*xodds<- exp(log_odds)prob<-odds/(1+odds)log_like<- y*log(prob)+(1-y)*log(1-prob)sum_ll<- sum(log_like)results<- cbind.data.frame("alpha"=alpha, "beta"=beta, "sum_ll"=sum_ll)all<- rbind(all, results)Maximum Likelihood Estimation
library(tidyverse)library(magrittr)mydata <- read.csv("https://stats.idre.ucla.edu/stat/data/binary.csv")#Program the likelihood:MyLogLike<-function(Y,X,par){xbeta<-X%*%parp<-exp(xbeta)/(1+exp(xbeta))loglike<-Y*log(p)+(1-Y)*(log(1-p))sum_ll= -sum(loglike)return(sum_ll)}Use -optim- to Find \(\beta_j\)
X<- mydata %>% mutate(cons=1, rank2=as.numeric(rank==2), rank3=as.numeric(rank==3), rank4=as.numeric(rank==4)) %>% select(cons, gre, gpa, rank2, rank3, rank4) %>% as.matrix()Y<-mydata$admitpar=rep(0,6)myres <- optim(par, # starting value for prob MyLogLike, # the log-likelihood function method="BFGS", # optimization method hessian=TRUE, # return numerical Hessian control=list(reltol=1e-10), # maximize instead of minimize X=X,Y=Y) # the datamyres$par#Check summary(m1<-glm(admit~gre+ gpa+ factor(rank), data=mydata, family=binomial))OLS Using Numerical Optimization
Though OLS coefficients can be found using an analytical solution \(\beta=(X'X)^{-1}X'Y\), they may also be found using numerical optimization.
To demonstrate, consider the following model:
$$\log{\text{(wage)}}=\alpha+\beta_1\text{jc}+\beta_2\text{univ}+\beta_3\text{exper}+\epsilon$$
- These data can be accessed from the package "wooldridge" using -data("twoyear")-.
OLS Using Numerical Optimization
library(wooldridge)data("twoyear")m2<-lm(lwage~jc+univ+exper, data=twoyear)summary(m1)#Program the likelihood:myOLS<-function(pars,X,Y) { xbeta<-X%*%pars SSE<-sum((Y-xbeta)^2) return(SSE)}X<-twoyear %>% mutate(cons=1) %>% select(cons,jc,univ,exper) %>% as.matrix()Y<-twoyear$lwagepars=rep(0,4)myres <- optim(pars, # starting value for prob myOLS, # the function to optimize method="BFGS", # optimization method Y=Y, X=X) # the datamyres$parInterpreting Logit Results
Logit coefficients tell the direction of the effects, but not their magnitude.
In fact, the values of the logit (and probit) coefficients are artificially induced by the model assumptions about the mean and variance of \(\epsilon\).
- If we change these assumptions, the coefficient estimates will change too.
However, the estimates of probability of \(Y=1\) and \(Y=0\) are invariant to the model assumptions. Hence, always interpret coefficient effects in logit (and probit) by calculating predicted probabilities or related quantities (example to follow).
As with OLS, can perform a significance hypothesis test by dividing the coefficient by it's standard error.
Interpreting Logit Results
mydata <- read.csv("https://stats.idre.ucla.edu/stat/data/binary.csv")summary(m1<-glm(admit~gre+ gpa+ factor(rank), data=mydata, family=binomial))## ## Call:## glm(formula = admit ~ gre + gpa + factor(rank), family = binomial, ## data = mydata)## ## Coefficients:## Estimate Std. Error z value Pr(>|z|) ## (Intercept) -3.989979 1.139951 -3.500 0.000465 ***## gre 0.002264 0.001094 2.070 0.038465 * ## gpa 0.804038 0.331819 2.423 0.015388 * ## factor(rank)2 -0.675443 0.316490 -2.134 0.032829 * ## factor(rank)3 -1.340204 0.345306 -3.881 0.000104 ***## factor(rank)4 -1.551464 0.417832 -3.713 0.000205 ***## ---## Signif. codes: 0 '***' 0.001 '**' 0.01 '*' 0.05 '.' 0.1 ' ' 1## ## (Dispersion parameter for binomial family taken to be 1)## ## Null deviance: 499.98 on 399 degrees of freedom## Residual deviance: 458.52 on 394 degrees of freedom## AIC: 470.52## ## Number of Fisher Scoring iterations: 4Interpreting Logit Results
Calculate and plot predicted probabilities of admission (first example), varying GPA and school rank. Hold GRE at its mean of 500.
mycoeff<-m1$coeffgpa<-seq(from=min(mydata$gpa),to=max(mydata$gpa),by=.1)#Calculate the probability of an admission for a student with average GRE (500) from a tier 1 school:p1<-(exp(mycoeff[1]+500*mycoeff[2]+gpa*mycoeff[3]))/(1+exp(mycoeff[1]+500*mycoeff[2]+gpa*mycoeff[3]))#Calculate the probability of an admission for a student with average GRE (500) from a tier 2 school:p2<-(exp(mycoeff[1]+500*mycoeff[2]+gpa*mycoeff[3]+mycoeff[4]))/(1+exp(mycoeff[1]+500*mycoeff[2]+gpa*mycoeff[3]+mycoeff[4]))#Calculate the probability of an admission for a student with average GRE (500) from a tier 3 school:p3<-(exp(mycoeff[1]+500*mycoeff[2]+gpa*mycoeff[3]+mycoeff[5]))/(1+exp(mycoeff[1]+500*mycoeff[2]+gpa*mycoeff[3]+mycoeff[5]))#Calculate the probability of an admission for a student with average GRE (500) from a tier 4 school:p4<-(exp(mycoeff[1]+500*mycoeff[2]+gpa*mycoeff[3]+mycoeff[6]))/(1+exp(mycoeff[1]+500*mycoeff[2]+gpa*mycoeff[3]+mycoeff[6]))#Plot these predicted probabilities:ggplot() + geom_line(aes(x=gpa, y=p1), ) + geom_line(aes(x=gpa,y=p2)) +geom_line(aes(x=gpa,y=p3))+geom_line(aes(x=gpa,y=p4))+ labs(y = "P(Admissions)") +theme_bw()Effect of GPA on Admissions by Rank

Example 2
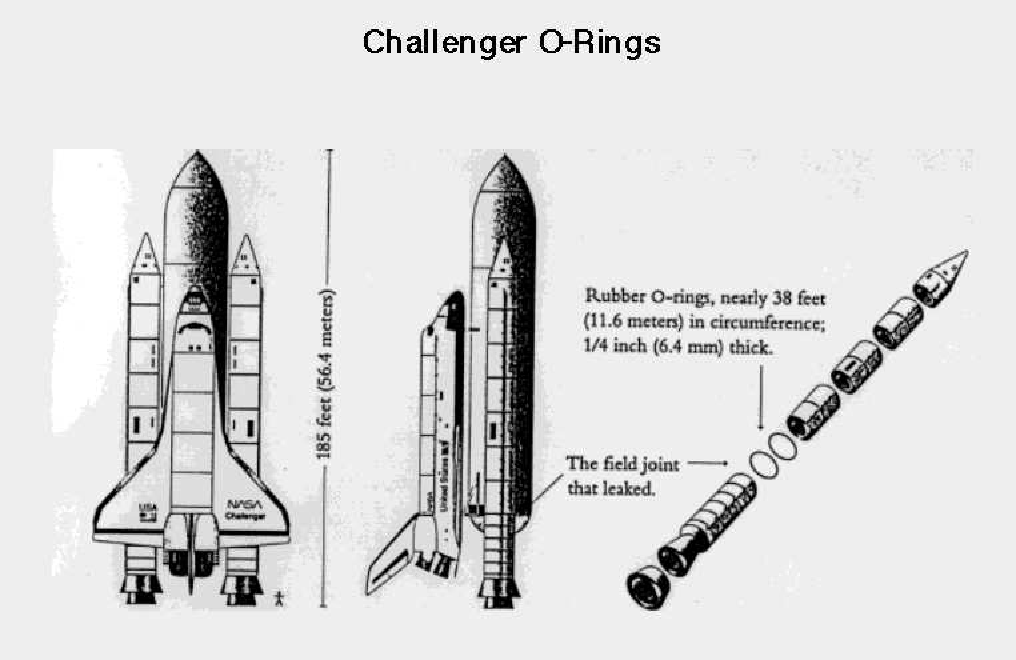
On January 28, 1986, the NASA shuttle orbiter mission STS-51-L and the tenth flight of Space Shuttle Challenger (OV-99) broke apart 73 seconds into its flight, killing all seven crew members, which consisted of five NASA astronauts and two payload specialists.
The spacecraft disintegrated over the Atlantic Ocean, off the coast of Cape Canaveral, Florida, at 11:39 EST (16:39 UTC).
Disintegration of the vehicle began after an O-ring seal in its right solid rocket booster (SRB) failed at liftoff.
Due to McAuliffe’s (first teacher in space) presence on the mission, NASA arranged for many US public schools to view the launch live on NASA TV.
Source: Wikipedia
Why Did the O-ring Fail?
What causes O-ring failures during space shuttle launches?
Research Hypothesis: Temperature at launch affects the probability of o-ring failures.
Data on Space Shuttle Launches
## flight_date failure temp## 1 1981-04-12 0 66## 17 1981-11-12 1 70## 2 1982-03-22 0 69## 3 1982-11-11 0 68## 4 1983-04-04 0 67## 5 1983-06-18 0 72## 6 1983-08-30 0 73## 7 1983-11-28 0 70## 18 1984-02-03 1 57## 19 1984-04-06 1 63## 20 1984-08-30 1 70## 8 1984-10-05 0 78## 9 1984-11-08 0 67## 22 1985-01-24 2 53## 10 1985-04-12 0 67## 11 1985-04-29 0 75## 12 1985-06-17 0 70## 13 1985-07-29 0 81## 14 1985-08-27 0 76## 15 1985-10-03 0 79## 23 1985-10-30 2 75## 16 1985-11-26 0 76## 21 1986-01-12 1 58Your Turn
Estimate a logistic regression of failures on temperature.
In order to interpret the result, calculate and plot the expected probability of an o-ring failure by temperature. Overlay your plot with a scatterplot of the data.
What is your conclusion? What would you say if I told you that the Challenger was launched at 31 degrees F?
Your Turn 1
Open the data from the social pressure experiment.
Estimate a linear probability model and a logistic regression. Calculate the effect of social pressure on the probability of voting from the logistic regression. How does this quantity compare to the coefficient on the same variable from the libear probability model.
Which model do you prefer and why?
Your Turn 2
Write a maximum likelihood function to estimate a probit.
Calculate and plot predicted probabilities of admission (first example), varying GPA and school rank. Hold GRE at its mean of 500. Do this "by hand", do not use the -predict- function.

Your Turn 2: Michelin Star Restaurants
- The data "MichelinNY.csv" contains information on the price, food, decor, and service ratings on 164 NY restaurants, and whether the restaurant received a Michelin star. Open the data and estimate the following model (can use the -glm- function):
$$\begin{equation} \text{Michelin Star}=\text{Probit}(\alpha+\beta_1\text{Price}+\beta_2\text{Food}+\\ \beta_3\text{Service}+\beta_4\text{Decor}+\epsilon) \end{equation}$$
Looking only at the regression table, what factors affect the probability of getting a Michelin star?
Plot the predicted probabilities of getting a Michelin star by food rating for three price points (Mean, Mean-1sd, Mean+1sd). Hold Service and Decor at their median values.

Your Turn 3
Open the data on space shuttle launches.
Estimate the effect of temperature at launch on the probability of at least one o-ring failure using a probit. Estimate the same probability using a logit.
Plot the predicted probability of a failure by temperature from both models (overlay them on the same graph). How do they compare?
Use the -predict- function to add confidence bands.