Advanced Network Analysis
ERGMs for Valued Networks
Olga Chyzh [www.olgachyzh.com]
Readings
Pavel N Krivitsky. Exponential-family random graph models for valued networks. Electronic Journal of Statistics, 6: 1110--1128, 2012.
Bruce A. Desmarais and Skyler J. Cranmer. Statistical inference for valued-edge networks: The generalized exponential random graph model. PloS One, 7(1), 2012.
Overview
- Many networks of interest have valued rather than binary edges, e.g. trade network, friendships, romantic relationships.
- Can generalize ERGMs to modeling networks with count or rank-ordered valued edges.
- Similar properties and estimation approach.
The Sample Space
For binary ERGMs, the sample space (or support) Y — the set of possible networks that can occur — is usually some subset of 2N, the set of all possible ways in which relationships among the actors may occur.
For the sample space of valued ERGMs, we need to define S, the set of possible values each relationship may take. For example, for count data, that’s S={0,1,…,s} if the maximum count is s and {0,1,…} if there is no a priori upper bound. Having specified that, Y is defined as some subset of SN: the set of possible ways to assign to each relationship a value.
Estimation
Valued ERGMs
The package
ergm.countextends theergmpackage to allow for modeling networks with valued edges. This is done by specifying theresponseargument with the name of the edge attribute to use as the response variable.New concept: a reference distribution
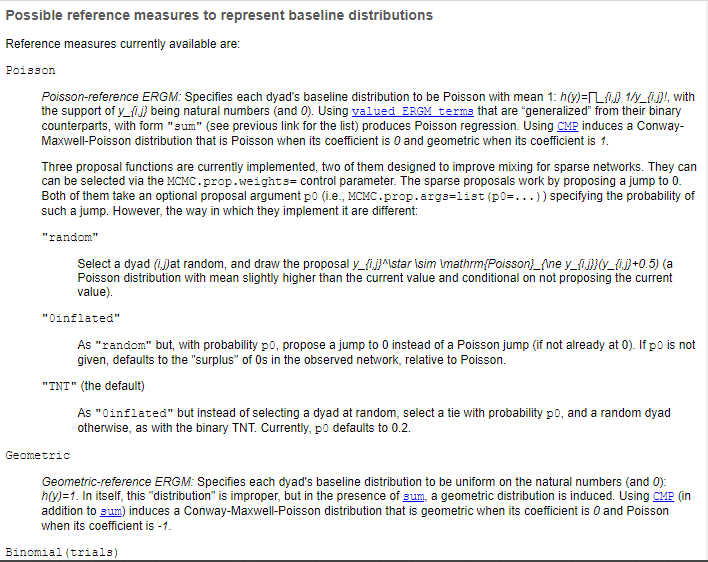
- Need to think about how the values for connections we measure are distributed. The reference distribution specifies the model for the data before we add any ERGM terms.
help("ergm-references")The Reference Distribution
Install Packages:
library(devtools)install_github("ochyzh/networkdata")#install.packages("ergm.count")library(statnet)library(ergm.count)library(networkdata)Load the Data
We are going to use Gade et al's data. Our dependent variable--- the valued network--- records the number of collaborations between rebel groups.
data(gadeData)# data characsactors = sort(unique(c(gadeData$Var1, gadeData$Var2)))gadeData<-sort(gadeData)gadeData$coopActions<-round(gadeData$coopActions^2)#These are the dyadic variables. They#must be in matrix form.dyadVars = names(gadeData)[c(3,5:8)]n = length(actors) ; p = length(dyadVars)# create empty arr object for all dyad varsdyadArray = array(0, dim=c(n,n,p), dimnames=list(actors,actors,dyadVars) )# loop through and fill infor(param in dyadVars){ for(i in 1:nrow(gadeData)){ a1 = gadeData$Var1[i] a2 = gadeData$Var2[i] val =gadeData[i,param] dyadArray[a1,a2,param] = val }}# These are node-level variables.nodeVars = names(gadeData)[9:11]nodeData = unique(gadeData[,c('Var1',nodeVars)])rownames(nodeData) = nodeData$Var1nodeData = nodeData[actors,c(-1)]# The DV must be a network objectnet = as.network( dyadArray[,,'coopActions'], directed=FALSE, loops=FALSE, matrix.type='adjacency', ignore.eval = FALSE, names.eval = "coopActions" )Look at the first 10 rows and cols:
as.matrix(net[1:10,1:10])## 101st 13th 1st AALS AARB AASB AASG ADF AF AFB## 101st 0 1 0 0 0 0 0 0 0 0## 13th 1 0 0 0 0 0 0 0 0 0## 1st 0 0 0 0 0 0 0 0 0 1## AALS 0 0 0 0 0 0 0 0 0 0## AARB 0 0 0 0 0 0 0 0 1 0## AASB 0 0 0 0 0 0 0 1 0 0## AASG 0 0 0 0 0 0 0 0 0 1## ADF 0 0 0 0 0 1 0 0 0 0## AF 0 0 0 0 1 0 0 0 0 0## AFB 0 0 1 0 0 0 1 0 0 0# Set node attributesfor(param in nodeVars){ network::set.vertex.attribute(net, param, nodeData[,param])}# Set network attributes:set.network.attribute(net,'loc.dyad',dyadArray[,,'loc.dyad'])set.network.attribute(net,'spons.dyad',dyadArray[,,'spons.dyad'])# We can view the attribute as a sociomatrix.as.matrix(net, attrname = "coopActions")[1:10, 1:10]## 101st 13th 1st AALS AARB AASB AASG ADF AF AFB## 101st 0 1 0 0 0 0 0 0 0 0## 13th 1 0 0 0 0 0 0 0 0 0## 1st 0 0 0 0 0 0 0 0 0 1## AALS 0 0 0 0 0 0 0 0 0 0## AARB 0 0 0 0 0 0 0 0 2 0## AASB 0 0 0 0 0 0 0 1 0 0## AASG 0 0 0 0 0 0 0 0 0 1## ADF 0 0 0 0 0 1 0 0 0 0## AF 0 0 0 0 2 0 0 0 0 0## AFB 0 0 1 0 0 0 1 0 0 0Make a Network Graph with Valued Edges:
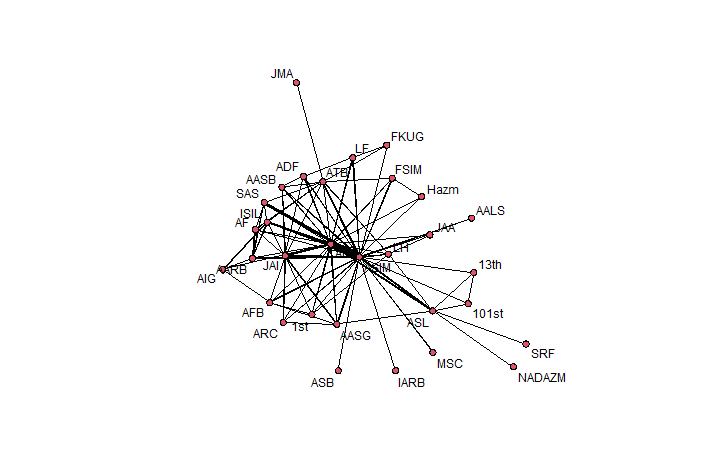
plot(net, edge.col = "black", usecurve = TRUE, edge.curve = 0, edge.lwd=.25*dyadArray[,,"coopActions"], displaylabels = TRUE)Make a Network Graph with Valued Edges:
Estimate a Valued ERGM
m0 <- ergm(net ~ sum + nodecov('averageId.node') + nodecov('size.node') + nodecov('spons_actor.node') + absdiff('averageId.node') + absdiff('size.node') + edgecov('loc.dyad') + edgecov('spons.dyad'), response = "coopActions", reference = ~Poisson)mcmc.diagnostics(m0)Diagnostics
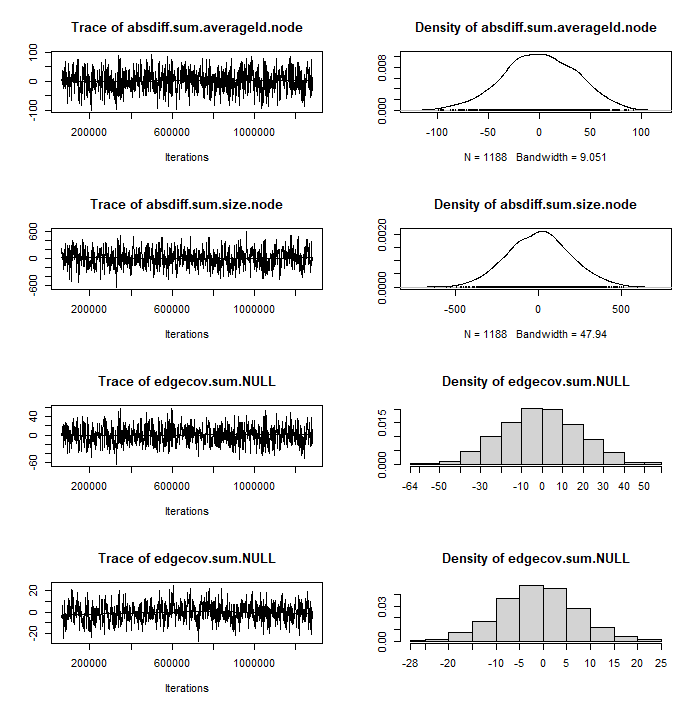
Table of Results
summary(m0)## Call:## ergm(formula = net ~ sum + nodecov("averageId.node") + nodecov("size.node") + ## nodecov("spons_actor.node") + absdiff("averageId.node") + ## absdiff("size.node") + edgecov("loc.dyad") + edgecov("spons.dyad"), ## response = "coopActions", reference = ~Poisson)## ## Monte Carlo Maximum Likelihood Results:## ## Estimate Std. Error MCMC % z value Pr(>|z|) ## sum -8.012597 1.117417 0 -7.171 < 1e-04 ***## nodecov.sum.averageId.node 0.564307 0.049284 0 11.450 < 1e-04 ***## nodecov.sum.size.node 0.074916 0.005851 0 12.803 < 1e-04 ***## nodecov.sum.spons_actor.node 0.748998 0.140239 0 5.341 < 1e-04 ***## absdiff.sum.averageId.node -0.179775 0.050796 0 -3.539 0.000401 ***## absdiff.sum.size.node -0.089858 0.010511 0 -8.549 < 1e-04 ***## edgecov.sum.NULL 3.834232 1.094595 0 3.503 0.000460 ***## edgecov.sum.NULL 0.597594 0.149731 0 3.991 < 1e-04 ***## ---## Signif. codes: 0 '***' 0.001 '**' 0.01 '*' 0.05 '.' 0.1 ' ' 1## ## Null Deviance: 0.0 on 465 degrees of freedom## Residual Deviance: -707.2 on 457 degrees of freedom## ## Note that the null model likelihood and deviance are defined to be 0.## This means that all likelihood-based inference (LRT, Analysis of## Deviance, AIC, BIC, etc.) is only valid between models with the same## reference distribution and constraints.## ## AIC: -691.2 BIC: -658.1 (Smaller is better. MC Std. Err. = 2.764)Interpretation
Let's calculate the expected number of links between two average rebel groups:
- Set all xs to their mean values
- Calculate the expected number as eXTβ
#to get the mean values (in same order as in our model)x_mean<-apply(data[,c(9,10,11,5,6,7,8)],2,mean)exp(c(1,x_mean)%*%m0$coef) #expected number of collaborationsYour Turn
Calculate the expected number of links between two average rebel groups with no ideological differences:
Accounting for Network Dependencies
Network Dependencies with Valued Edges
Goal: model endogenous network dependencies
Complication: valued edges obviate intuitive network measures, such as triangles and k-stars.
Need to re-conceptualize existing measures to adapt to the context of valued edges.
Individual Heterogeneity.
- A count equivalent to k-stars:
Actors may have different overall propensities to interact. This has been modeled using using degeneracy-prone terms like k-star counts. With valued ERGMs, a more robust measure is:
gactor cov.gactor cov.(yy)=∑i∈N1n−2∑j,k∈Yi∧j<k(√yyi,j−¯¯¯¯¯¯¯¯√yy)(√yyi,k−¯¯¯¯¯¯¯¯√yy)
This is essentially a measure of covariance between the squared values of edges incident (originating) from the same actor. Implemented with the term nodecovar(transform="sqrt").
Triadic Closure

Triadic Closure
transitiveweights(twopath, combine, affect)
twopath---given yyi,j and yyk,j, how to compute the value for the two-path?"min"---the minimum of their values"geomean---geometric mean
combine---given the strength of the two-paths yyi−>k−>j for all k≠i,j, how to combine the values?"max"--- the strength of the strongest path"sum"---the sum of path strength
affect---given the combined strength of the two-paths between i and j, how should they affect YYi,j?"min""geomean"
Transitiveweights, Two-Path

- Two-Pathmin(2,5)=2
- Two-Pathgeomean(2,5)=√(2∗5)=√10
Transitiveweights, Combine

- Combinemax=max(Two-path23)
- Combinesum=sum(Two-path23)
Transitiveweights, Affect
For all pairs connected by two-paths:
- Affectmin=min(Combineij)
- Affectgeomean=geomean(Combineij)
Example
m1 <- ergm(net ~ sum + nodecov('averageId.node') + nodecov('size.node') + nodecov('spons_actor.node') + absdiff('averageId.node') + absdiff('size.node') + edgecov('loc.dyad') + edgecov('spons.dyad')+ transitiveweights("min","max","min"), response = "coopActions", reference = ~Poisson)par(mfrow = c(3,2))mcmc.diagnostics(m1)Diagnostics
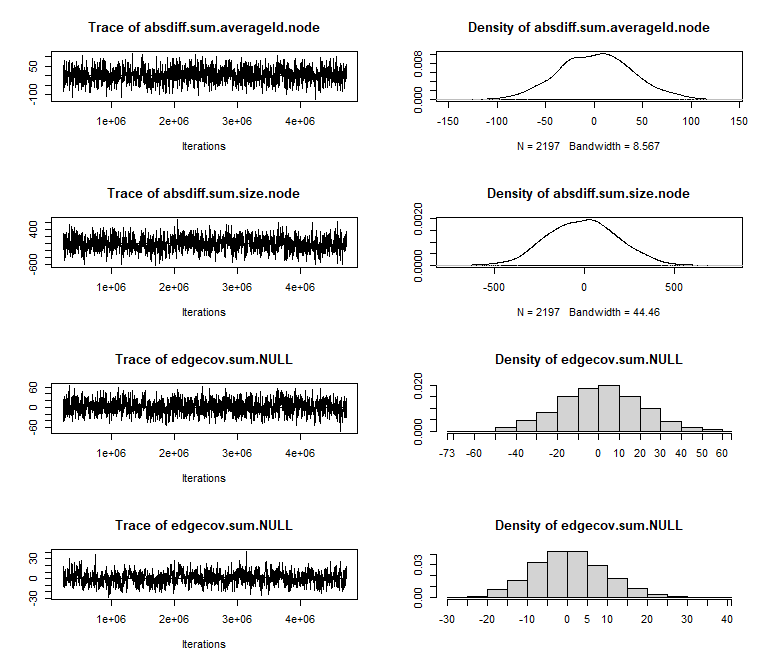
Table of Results
summary(m1)## Call:## ergm(formula = net ~ sum + nodecov("averageId.node") + nodecov("size.node") + ## nodecov("spons_actor.node") + absdiff("averageId.node") + ## absdiff("size.node") + edgecov("loc.dyad") + edgecov("spons.dyad") + ## transitiveweights("min", "max", "min"), response = "coopActions", ## reference = ~Poisson)## ## Monte Carlo Maximum Likelihood Results:## ## Estimate Std. Error MCMC % z value Pr(>|z|) ## sum -7.454511 1.063267 0 -7.011 < 1e-04 ***## nodecov.sum.averageId.node 0.551644 0.049526 0 11.138 < 1e-04 ***## nodecov.sum.size.node 0.067389 0.005726 0 11.770 < 1e-04 ***## nodecov.sum.spons_actor.node 0.828172 0.132405 0 6.255 < 1e-04 ***## absdiff.sum.averageId.node -0.159866 0.044402 0 -3.600 0.000318 ***## absdiff.sum.size.node -0.078650 0.009654 0 -8.147 < 1e-04 ***## edgecov.sum.NULL 3.805675 1.017857 0 3.739 0.000185 ***## edgecov.sum.NULL 0.528179 0.126521 0 4.175 < 1e-04 ***## transitiveweights.min.max.min -0.628822 0.046141 0 -13.628 < 1e-04 ***## ---## Signif. codes: 0 '***' 0.001 '**' 0.01 '*' 0.05 '.' 0.1 ' ' 1## ## Null Deviance: 0.0 on 465 degrees of freedom## Residual Deviance: -810.9 on 456 degrees of freedom## ## Note that the null model likelihood and deviance are defined to be 0.## This means that all likelihood-based inference (LRT, Analysis of## Deviance, AIC, BIC, etc.) is only valid between models with the same## reference distribution and constraints.## ## AIC: -792.9 BIC: -755.7 (Smaller is better. MC Std. Err. = 1.921)Simulating Networks
Simulating Networks
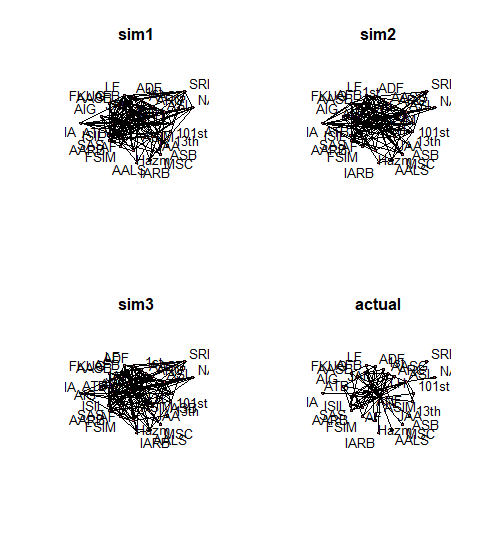
We can use the estimates from our model to simulate a network (just like with ERGMs). If the simulated networks look similar to the observed network, then our model has a good fit.
# Simulate from model fit:simNets <- simulate(m1, nsim = 3)# Define a plotting function:plotSimNet = function(net, label){ set.seed(6886) plot(net, edge.col = "black", usecurve = TRUE, edge.curve = 0, edge.lwd=.1*dyadArray[,,"coopActions"], displaylabels = TRUE) title(label) }par(mfrow = c(2, 2))# add actual network to list of sim nets# for comparisonsimNets[[4]] = netlabels = c(paste0("sim",1:3), 'actual')lapply(1:length(simNets), function(i){ plotSimNet(simNets[[i]], labels[i]) })Observed vs. Simulated Networks
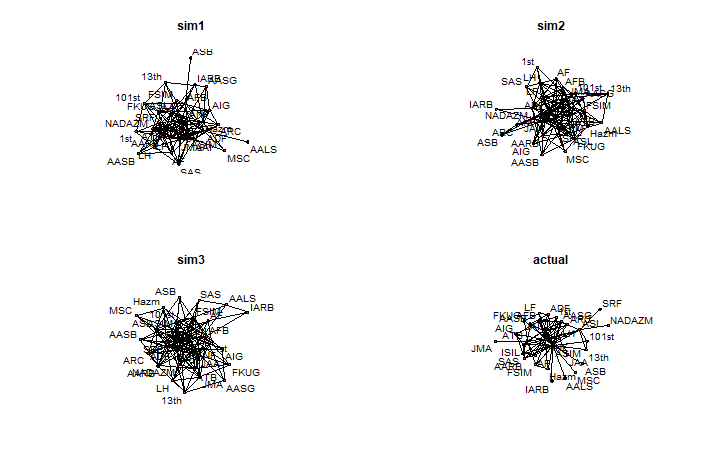
## [[1]]## NULL## ## [[2]]## NULL## ## [[3]]## NULL## ## [[4]]## NULLWith Fixed Coordinates:
#Plot the original network to get the layout:set.seed(6886)p<-plot(net, edge.col = "black", usecurve = TRUE, edge.curve = 0, edge.lwd=.25*dyadArray[,,"coopActions"], displaylabels = TRUE)
# Define a plotting function:plotSimNet = function(net, label){ set.seed(6886) plot(net, edge.col = "black", usecurve = TRUE, edge.curve = 0, edge.lwd=.1*dyadArray[,,"coopActions"], displaylabels = TRUE, coord=p) title(label) }Observed vs. Simulated Networks (Fixed Coord.)
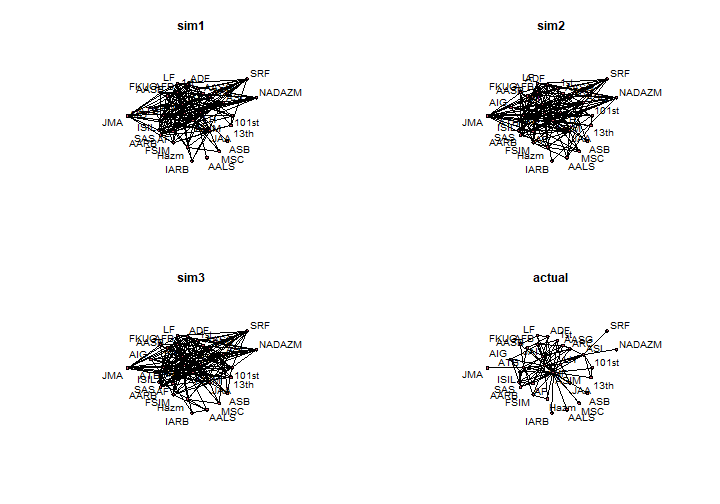
## [[1]]## NULL## ## [[2]]## NULL## ## [[3]]## NULL## ## [[4]]## NULLAssessing Model Fit
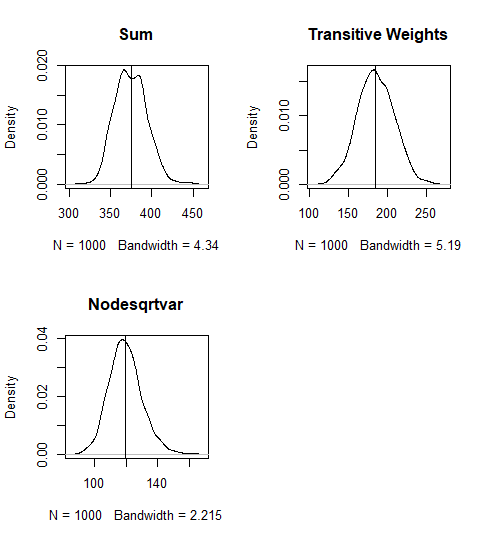
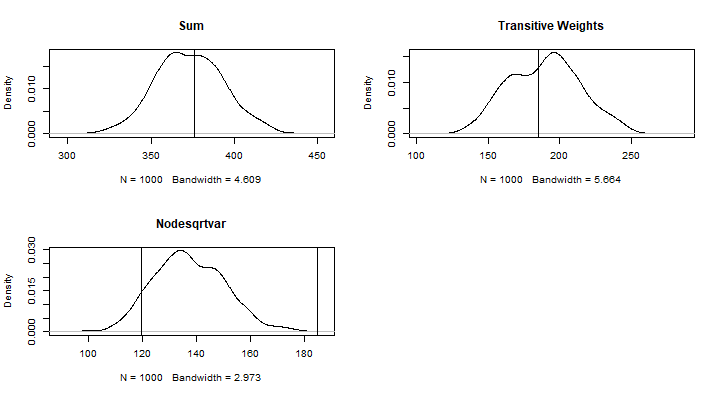
In the above exercise, we compared our network to only 3 simulated networks. Ideally, we would like to compare it to more than 3. Since it's difficult to look at thousands of simulated networks on a graph, a way to compare our network to thousands of such simulated networks is by summarizing the characteristics of these simulated networks, such as the sum of edges or various other measures.
Notice that in the code below that, in addition to network statistics included in model m1, we can also summarize statistics that were not explicitly included in m1, such as nodecovar(transform="sqrt"). This is because our simulated networks may still exhibit vertex heterogeneity as a function of the modeled network properties (e.g. triangles), i.e. more triangles may also lead to more k-stars.
Also notice that I specified output="stats". Since I only care about network summaries, I am telling the function to NOT save the actual simulated networks, but only their summary statistics. This saves memory space.
# Simulate from model fit:simNets1000 <- simulate(m1, monitor = ~ nodecovar(transform="sqrt"), nsim = 1000, output = "stats")Results of the Simulation
colnames(simNets1000)## [1] "sum" "nodecov.sum.averageId.node" ## [3] "nodecov.sum.size.node" "nodecov.sum.spons_actor.node" ## [5] "absdiff.sum.averageId.node" "absdiff.sum.size.node" ## [7] "edgecov.sum.loc.dyad" "edgecov.sum.spons.dyad" ## [9] "transitiveweights.min.max.min" "nodecovar"Plot the Summary of the Simulations
#How prevalent are k-stars in the observed network?obsNet<-summary(net~sum+transitiveweights("min","max","min")+nodecovar(transform="sqrt"), response = "coopActions")par(mfrow = c(2, 2))#1st col.=sumplot(density(simNets1000[,1]), main="")abline(v = obsNet[1])title("Sum")# 9th col. = transitiveweightsplot(density(simNets1000[,9]), main="")abline(v = obsNet[2])title("Transitive Weights")# 10th col. = nodesqrtcovarplot(density(simNets1000[,10]), main="")abline(v = obsNet)title("Nodesqrtvar")Plot the Summary of the Simulations
Improve Model Specofication
m2 <- ergm(net ~ sum + nodecov('averageId.node') + nodecov('size.node') + nodecov('spons_actor.node') + absdiff('averageId.node') + absdiff('size.node') + edgecov('loc.dyad') + edgecov('spons.dyad')+ transitiveweights("min","max","min")+ nodecovar(transform="sqrt"), response = "coopActions", reference = ~Poisson)Improve Model Specification
## Call:## ergm(formula = net ~ sum + nodecov("averageId.node") + nodecov("size.node") + ## nodecov("spons_actor.node") + absdiff("averageId.node") + ## absdiff("size.node") + edgecov("loc.dyad") + edgecov("spons.dyad") + ## transitiveweights("min", "max", "min") + nodecovar(transform = "sqrt"), ## response = "coopActions", reference = ~Poisson)## ## Monte Carlo Maximum Likelihood Results:## ## Estimate Std. Error MCMC % z value Pr(>|z|) ## sum -6.594598 1.084880 0 -6.079 < 1e-04 ***## nodecov.sum.averageId.node 0.510330 0.047484 0 10.747 < 1e-04 ***## nodecov.sum.size.node 0.057320 0.005981 0 9.584 < 1e-04 ***## nodecov.sum.spons_actor.node 0.808021 0.126655 0 6.380 < 1e-04 ***## absdiff.sum.averageId.node -0.085453 0.036289 0 -2.355 0.018535 * ## absdiff.sum.size.node -0.052703 0.009241 0 -5.703 < 1e-04 ***## edgecov.sum.NULL 3.580399 1.020037 0 3.510 0.000448 ***## edgecov.sum.NULL 0.304451 0.124577 0 2.444 0.014530 * ## transitiveweights.min.max.min -0.432002 0.066354 0 -6.511 < 1e-04 ***## nodecovar -1.109736 0.242183 0 -4.582 < 1e-04 ***## ---## Signif. codes: 0 '***' 0.001 '**' 0.01 '*' 0.05 '.' 0.1 ' ' 1## ## Null Deviance: 0.0 on 465 degrees of freedom## Residual Deviance: -832.7 on 455 degrees of freedom## ## Note that the null model likelihood and deviance are defined to be 0.## This means that all likelihood-based inference (LRT, Analysis of## Deviance, AIC, BIC, etc.) is only valid between models with the same## reference distribution and constraints.## ## AIC: -812.7 BIC: -771.3 (Smaller is better. MC Std. Err. = 2.359)Your Turn
Follow the steps we did for m1 to evaluate the fit of model m2. Start by simulating a small number of networks, plot them and compare them to the observed network. Then simulate 1000 networks and compare them to the observed network on the key network statistics. Does m2 have a better fit?
