Advanced Network Analysis
ERGM Application
Shahryar Minhas [s7minhas.com/]
Readings
- Steven M. Goodreau, James A. Kitts, and Martina Morris. Birds of a feather, or friend of a friend? using exponential random graph models to investigate adolescent social networks. Demography, 46(1):103--125, 2009.
Goodreau et al, 2009
Goal: to identify the determinants of friendship formation that lead to pervasive regularities in friendship structure among adolescent students
Three mechanisms:
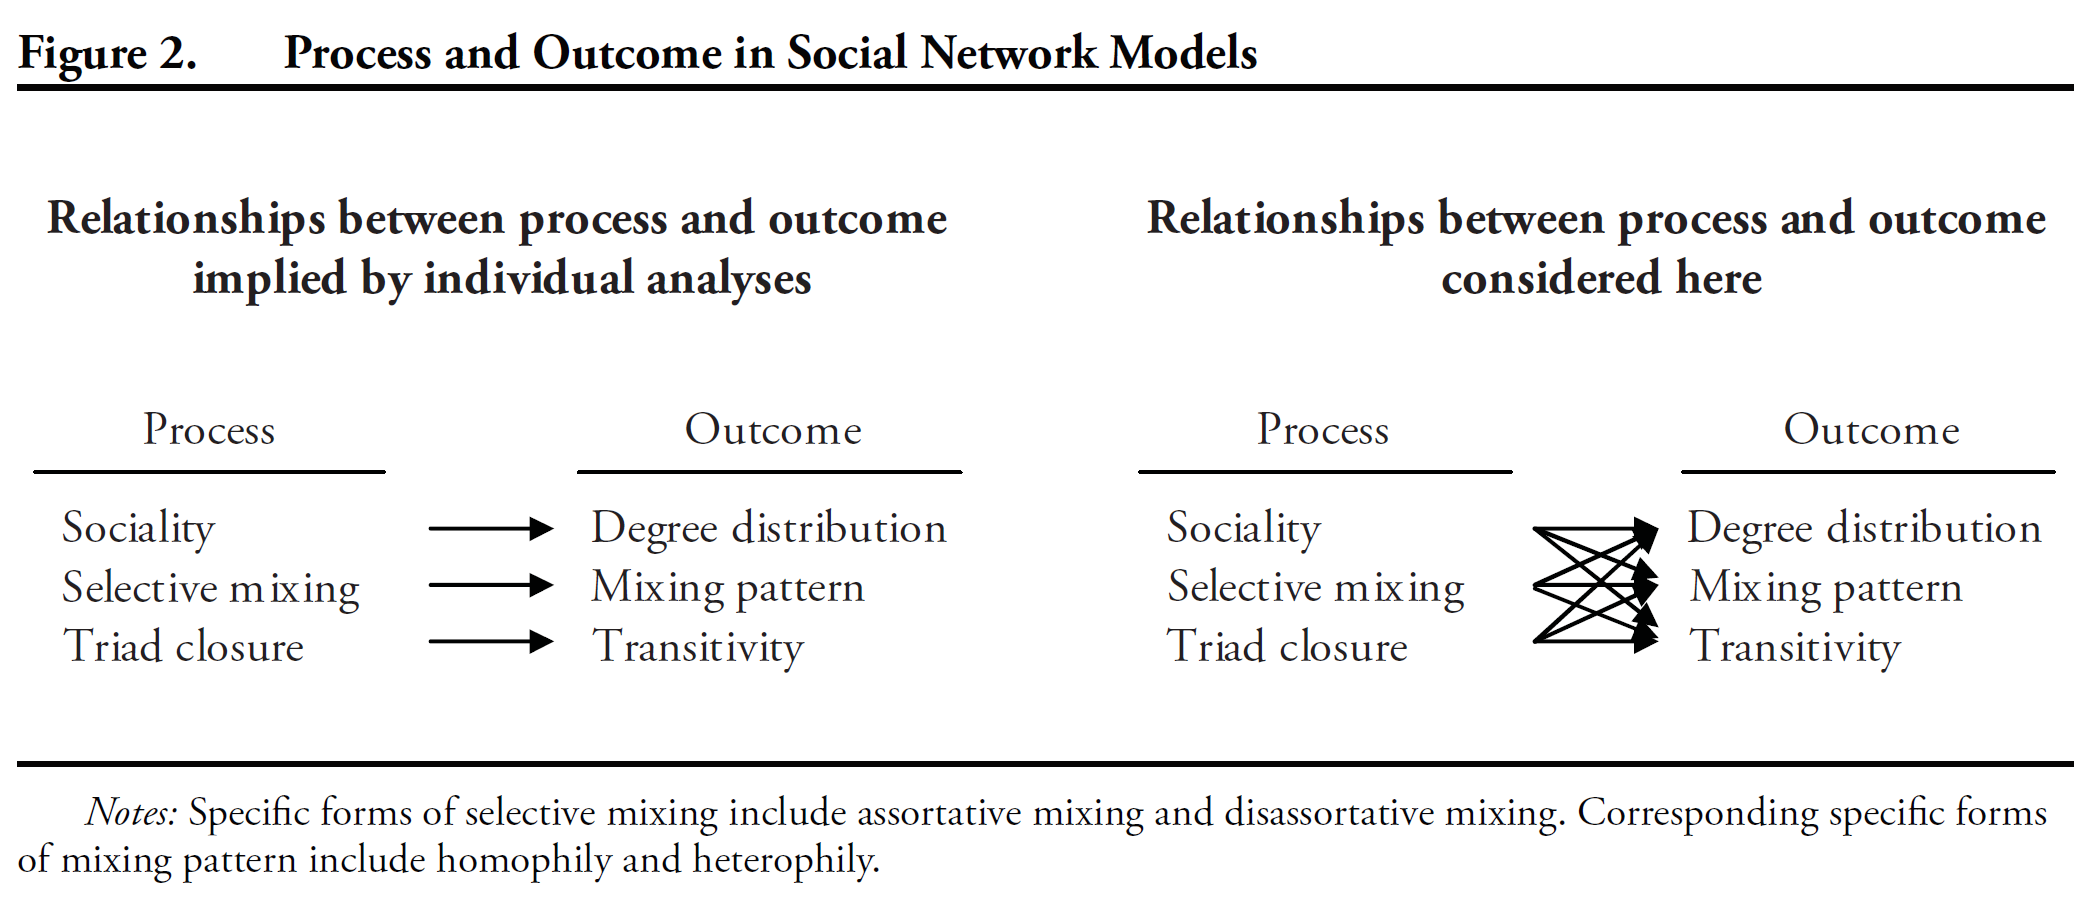
Sociality---heterogeneity among individuals in their propensity to establish friendship ties, e.g. 7th-graders are more social than 8th-graders.
Selective mixing is a dyad-level process by which pairs form (or break) relationships based on their combination of individual attributes. Assortative mixing is the greater propensity to partner with others having attributes similar to one's own. The resulting pattern---homophily--- is the predominance of within-group ties.
Triad Closure leads to the outcome of transitivity. Possible mechanisms include increased chance for interaction and tendency for structural balance (i.e. a friend of my friend is my friend).
Goodreau et al, 2009
Additional mechanisms:
- Homophily may also be amplified by triad closure if there is already a tendency toward assortative mixing.
- Transitivity may also result from assortative mixing since increasing the likelihood of within category ties enhances the opportunity for completed triangles within categories, especially when groups are small.
- Population composition---the opportunity for partner selection is constrained by the available pool of partners.
Data
- Friendship data from the first wave of Add Health, a sample of more than 90,000 U.S. students in grades 7 through 12, obtained in 1994–1995 through a stratifed sample of schools.
- The questionnaire provided a school roster and asked students to identify their five best male and five best female friends, in order of closeness.
- Students were allowed to nominate friends outside school or missing from the roster, or to stop before nominating five friends of either sex.
- Most students listed fewer friends than the maximum, but for the remainder, there may be some truncation. When would this be a problem?
Open Data
rm(list=ls())library(statnet)data(faux.mesa.high) mesa <- faux.mesa.highmesa## Network attributes:## vertices = 205 ## directed = FALSE ## hyper = FALSE ## loops = FALSE ## multiple = FALSE ## bipartite = FALSE ## total edges= 203 ## missing edges= 0 ## non-missing edges= 203 ## ## Vertex attribute names: ## Grade Race Sex ## ## No edge attributesPlot Data
par(mfrow=c(1,1)) # Back to 1-panel plotsplot(mesa, vertex.col='Grade')legend('bottomleft',fill=7:12, legend=paste('Grade',7:12),cex=0.75)Plot Data

Model Specification
Sociality
Goodreau et al (2009, 111) "infer sociality based on counts of ties observed: \(s\) represents the total
number of ties, and \(k_i\) is the total number of ties for all persons with attribute value \(i\). The \(s\)
term acts as an intercept [edges], and the coefficient for \(s\) represents the conditional log-odds of a
tie for the reference category (in these models, reference categories are grade 7, white, and
male). The \(k_i\) terms assume homogeneity within attribute class, allowing each race, sex, and
grade to have different mean sociality."
Sociality
Can also use the search function to find the relevant terms.
search.ergmTerms('sociality')## Found 5 matching ergm terms:## b1sociality(nodes=-1) (binary)## b1sociality(nodes=-1, form="sum") (valued)## Degree## ## b2sociality(nodes=-1) (binary)## b2sociality(nodes=-1, form="sum") (valued)## Degree## ## receiver(base=1, nodes=-1) (binary)## receiver(base=1, nodes=-1, form="sum") (valued)## Receiver effect## ## sender(base=1, nodes=-1) (binary)## sender(base=1, nodes=-1, form="sum") (valued)## Sender effect## ## sociality(attr=NULL, base=1, levels=NULL, nodes=-1) (binary)## sociality(attr=NULL, base=1, levels=NULL, nodes=-1, form="sum") (valued)## Undirected degreeSociality
- Authors' use the term
nodefactor. - Term
nodefactoradds multiple network statistics to the model, one for each of the unique values of the attribute. Each of these statistics gives the number of times a node with that attribute or those attributes appears in an edge in the network. - Note:
nodefactorassumes non-numeric (e.g., character, factor) class, so recode "Grade" as a character.
Sociality
Based on this description, the model so far is specified as:
table(mesa %v% 'Race') # Frequencies of racetable(mesa %v% 'Sex') # Frequencies of sextable(mesa %v% 'Grade') # Frequencies of Grademesa %v% "Grade" <-as.character(mesa %v% "Grade")m1<- ergm(mesa~edges+nodefactor("Race",levels=c("Black","Hisp","Other"))+ nodefactor("Sex", levels="F")+ nodefactor("Grade", levels=c("8","9","10","11","12")))Sociality
- Note that we specified levels for each
nodefactoras to make sure that the reference categories match those of Goodreau et al. - The description of
nodefactorin?ergm.termssays that including each level is not a good idea (need a reference category, just like with categorical variables in OLS). - If we get a positive coefficient on any categories within Race, Sex, and/or Grade, we will infer that students with that characteristic are, on average, more social.
Selective Mixing
Two selective mixing dynamics:
- A homogeneous propensity for assortative mixing across attribute categories (“uniform homophily”).
- A propensity that is specific to individual categories (“differential homophily”).
"Statistics are as follows: first, \(h\) is the total number of ties between persons in the same attribute category, regardless of category. This uniform homophily is used for sex since there are only three tie types (MM, MF, FF); with main effects included, only one degree of freedom remains. Second, \(h_i\) is the total number of ties between persons both in attribute category \(i\). There is one such statistic for each category of the attribute. This differential homophily is used for race and grade."
Selective Mixing
Can also use the search function to find the relevant terms.
search.ergmTerms('homophily')## Found 13 matching ergm terms:## b1degrange(from, to=`+Inf`, by=NULL, homophily=FALSE, levels=NULL) (binary)## Degree range for the first mode in a bipartite network## ## b1degree(d, by=NULL, levels=NULL) (binary)## Degree for the first mode in a bipartite network## ## b1nodematch(attr, diff=FALSE, keep=NULL, alpha=1, beta=1, byb2attr=NULL, levels=NULL) (binary)## Nodal attribute-based homophily effect for the first mode in a bipartite network## ## b2degrange(from, to=+Inf, by=NULL, homophily=FALSE, levels=NULL) (binary)## Degree range for the second mode in a bipartite network## ## b2nodematch(attr, diff=FALSE, keep=NULL, alpha=1, beta=1, byb1attr=NULL, levels=NULL) (binary)## Nodal attribute-based homophily effect for the second mode in a bipartite network## ## degrange(from, to=+Inf, by=NULL, homophily=FALSE, levels=NULL) (binary)## Degree range## ## degree(d, by=NULL, homophily=FALSE, levels=NULL) (binary)## Degree## ## For(...) (binary, valued)## A for operator for terms## ## idegrange(from, to=+Inf, by=NULL, homophily=FALSE, levels=NULL) (binary)## In-degree range## ## idegree(d, by=NULL, homophily=FALSE, levels=NULL) (binary)## In-degree## ## nodematch(attr, diff=FALSE, keep=NULL, levels=NULL) (binary)## nodematch(attr, diff=FALSE, keep=NULL, levels=NULL, form="sum") (valued)## match(attr, diff=FALSE, keep=NULL, levels=NULL, form="sum") (valued)## Uniform homophily and differential homophily## ## odegrange(from, to=+Inf, by=NULL, homophily=FALSE, levels=NULL) (binary)## Out-degree range## ## odegree(d, by=NULL, homophily=FALSE, levels=NULL) (binary)## Out-degree- Term
nodematchsounds like a good candidate.
Mixing Matrix
We want to only include groups with non-empty cells. For example, if no Black students named each other as friends, we would have no mixing (perfect separation) for the
nodematch.Blackcategory.Check our summary statistics
summary(mesa~edges+nodefactor("Race")+ nodefactor("Sex", levels="F")+ nodefactor("Grade", levels=c("8","9","10","11","12"))+ nodematch("Sex")+ nodematch("Race",diff=TRUE)+ nodematch("Grade",diff=TRUE)+ gwesp(decay=0.25) )#Also can:mixingmatrix(mesa, "Race")Check Our Summary Statistics
## edges nodefactor.Race.Hisp nodefactor.Race.NatAm ## 203 178 156 ## nodefactor.Race.Other nodefactor.Race.White nodefactor.Sex.F ## 1 45 235 ## nodefactor.Grade.8 nodefactor.Grade.9 nodefactor.Grade.10 ## 75 65 36 ## nodefactor.Grade.11 nodefactor.Grade.12 nodematch.Sex ## 49 28 132 ## nodematch.Race.Black nodematch.Race.Hisp nodematch.Race.NatAm ## 0 53 46 ## nodematch.Race.Other nodematch.Race.White nodematch.Grade.7 ## 0 4 75 ## nodematch.Grade.8 nodematch.Grade.9 nodematch.Grade.10 ## 33 23 9 ## nodematch.Grade.11 nodematch.Grade.12 esp#1 ## 17 6 70 ## esp#2 esp#3 esp#4 ## 36 13 0 ## esp#5 esp#6 esp#7 ## 1 0 0 ## esp#8 esp#9 esp#10 ## 0 0 0 ## esp#11 esp#12 esp#13 ## 0 0 0 ## esp#14 esp#15 esp#16 ## 0 0 0 ## esp#17 esp#18 esp#19 ## 0 0 0 ## esp#20 esp#21 esp#22 ## 0 0 0 ## esp#23 esp#24 esp#25 ## 0 0 0 ## esp#26 esp#27 esp#28 ## 0 0 0 ## esp#29 esp#30 ## 0 0Include Categories with Non-Empty Cells:
m3<- ergm(mesa~edges+nodefactor("Race",levels=c("Black","Hisp","NatAm","Other"))+ nodefactor("Sex", levels="F")+ nodefactor("Grade", levels=c("8","9","10","11","12"))+ nodematch("Sex")+ nodematch("Race",levels=c("White","Hisp","NatAm"),diff=TRUE)+ nodematch("Grade",diff=TRUE)+ gwesp(decay=0.25), control=control.ergm(seed=6886, MCMC.samplesize=10000, MCMLE.maxit=50 ) )summary(m3)Note: option diff specifies whether there can be differences in probability of friendships between groups.
- Use
absdiffinstead ofnodematchfor continuous variables (e.g. wealth).
Selective Mixing: Interpretation
To calculate the probability of a tie between two women, set
nodefactor("Sex", levels="F")=1andnodematch("Sex")=1, and all other variables to the values of interest.To calculate the probability of a tie between two men, set
nodefactor("Sex", levels="F")=0andnodematch("Sex")=1, and all other variables to the values of interest.To calculate the probability of a tie between a woman and a man, set
nodefactor("Sex", levels="F")=1andnodematch("Sex")=0, and all other variables to the values of interest.
Triad Closure
"For the reasons described above, we investigate triad closure using the GWESP statistic. We adopt a value of \(0.25\) for decay, although results are robust to this choice."
Based on this description, we can further specify the model as:
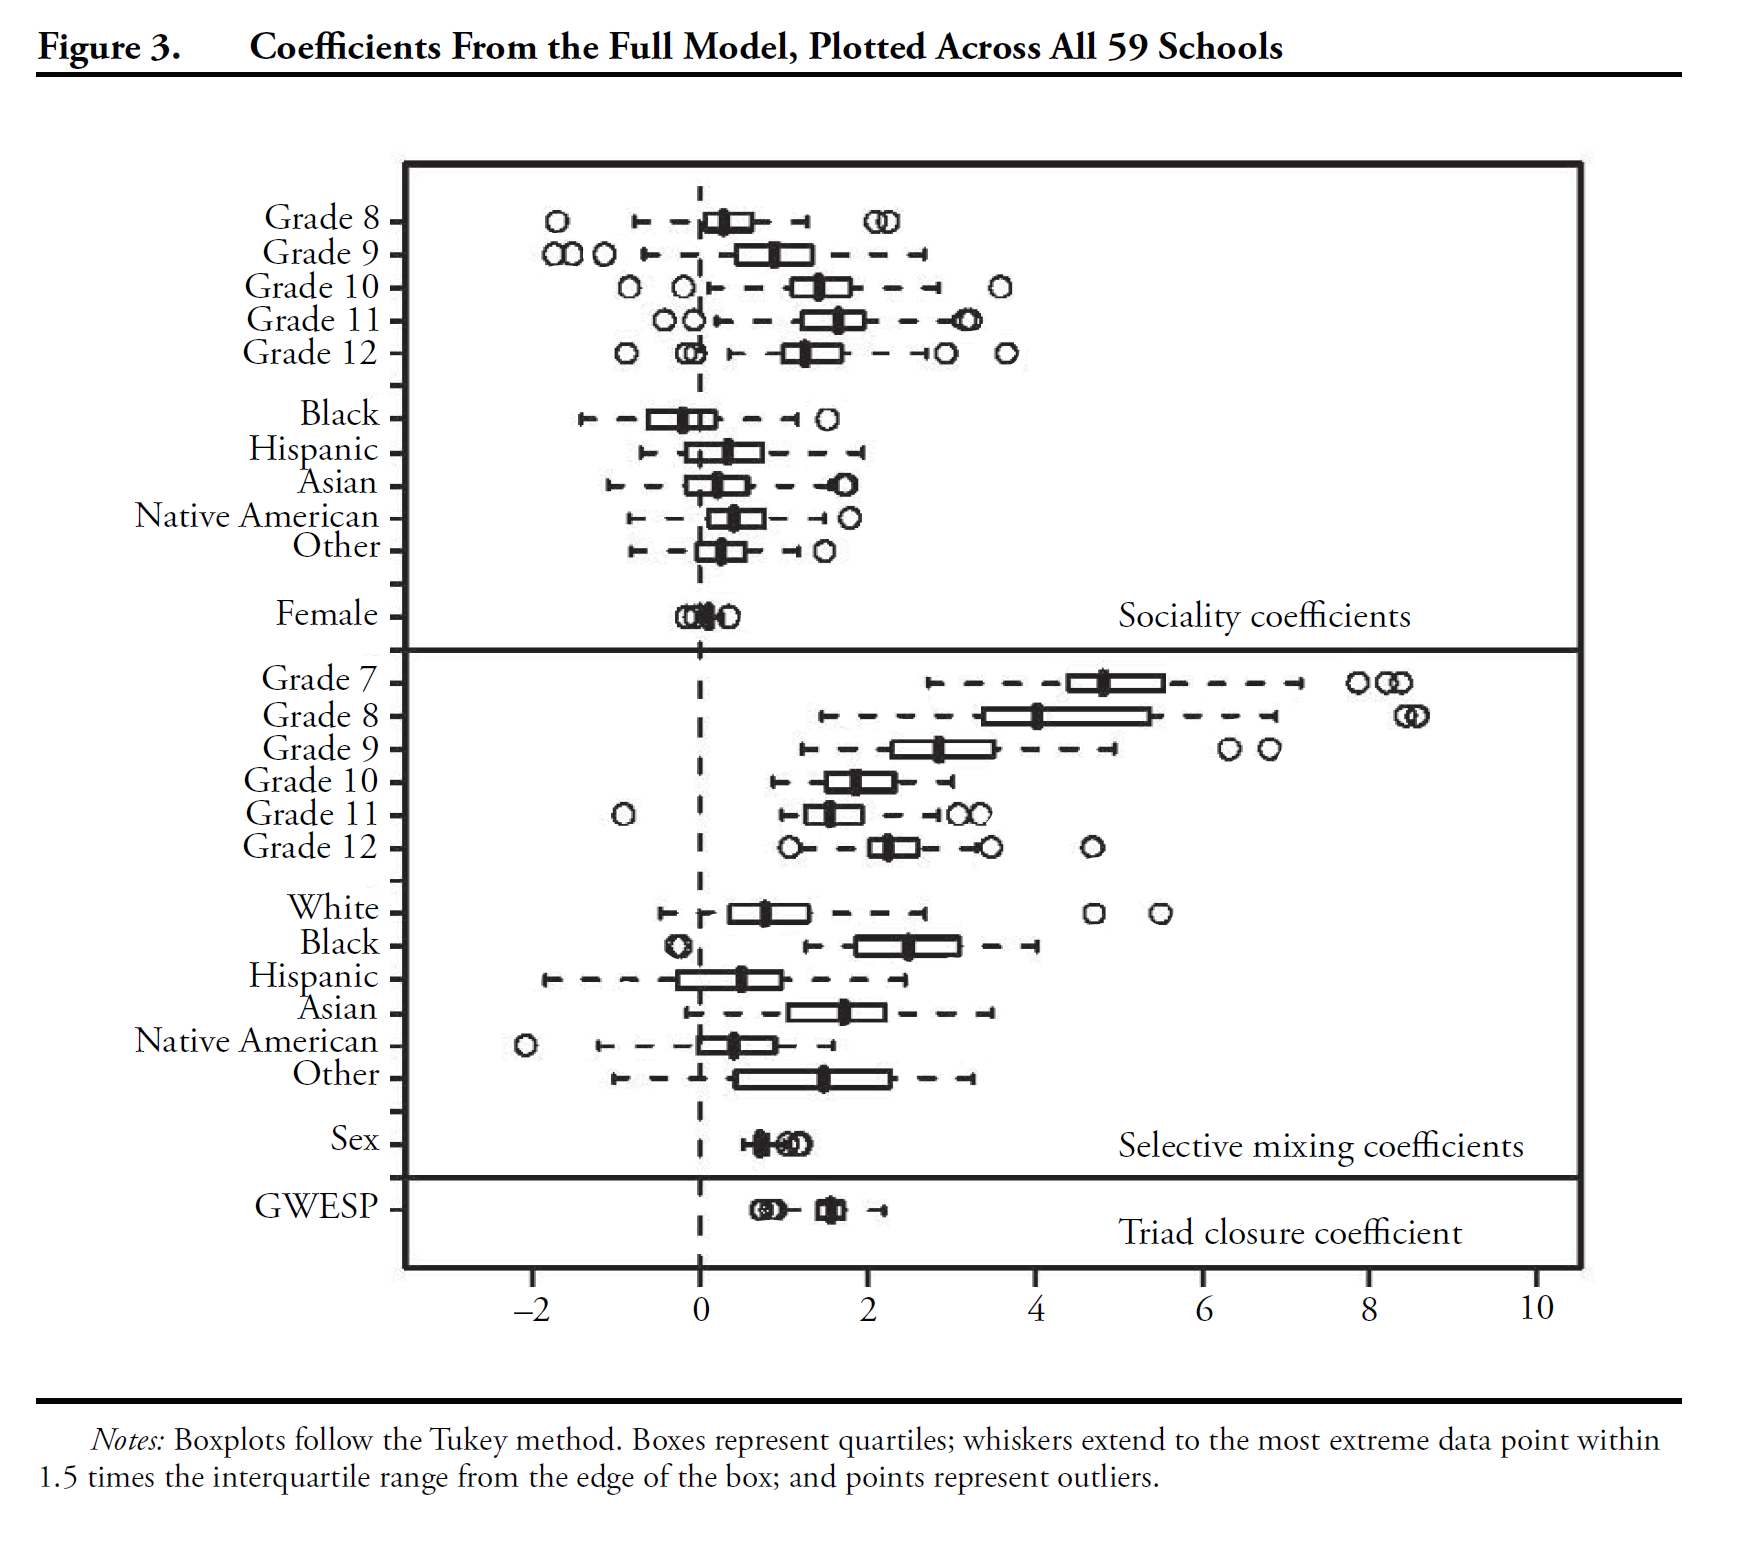
mesa %v% "Grade" <-as.character(mesa %v% "Grade")m1<- ergm(mesa~edges+nodefactor("Race",levels=c("Black","Hisp","NatAm","Other"))+ nodefactor("Sex", levels="F")+ nodefactor("Grade", levels=c("8","9","10","11","12"))+ nodematch("Sex")+nodematch("Race",levels=c("White","Hisp","NatAm"),diff=TRUE)+nodematch("Grade",diff=TRUE)+ gwesp(decay=0.25) )par(mfrow = c(3, 2))mcmc.diagnostics(m1)Results
Our Replication: M1 Diagnostics
Increase the Number of Simulations.
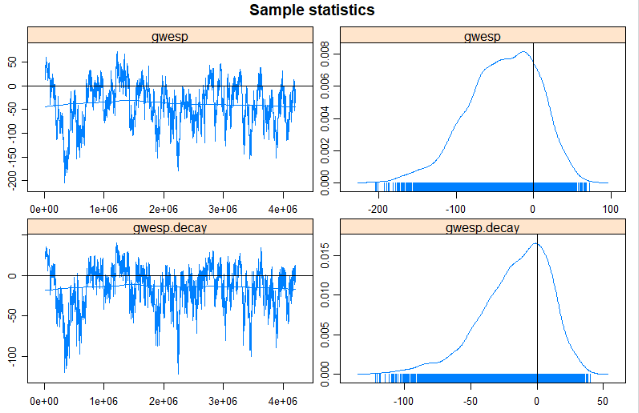
m2<- ergm(mesa~edges+nodefactor("Race",levels=c("Black","Hisp","NatAm","Other"))+ nodefactor("Sex", levels="F")+ nodefactor("Grade", levels=c("8","9","10","11","12"))+ nodematch("Sex")+nodematch("Race",levels=c("White","Hisp","NatAm"),diff=TRUE)+ nodematch("Grade",diff=TRUE)+gwesp(decay=0.25), control=control.ergm(seed=6886, MCMC.samplesize=10000, MCMLE.maxit=50) )par(mfrow = c(3, 2))mcmc.diagnostics(m2)Results
Results
## Results:## ## Estimate Std. Error MCMC % z value Pr(>|z|) ## edges -10.22281 1.17910 0 -8.670 < 1e-04 ***## nodefactor.Race.Black 0.61845 0.24268 0 2.548 0.010822 * ## nodefactor.Race.Hisp -0.49867 0.23138 0 -2.155 0.031144 * ## nodefactor.Race.NatAm -0.47808 0.20968 0 -2.280 0.022603 * ## nodefactor.Race.Other -1.54877 0.96497 0 -1.605 0.108496 ## nodefactor.Sex.F 0.13086 0.06715 0 1.949 0.051314 . ## nodefactor.Grade.8 1.45656 0.66174 0 2.201 0.027729 * ## nodefactor.Grade.9 2.22394 0.62197 0 3.576 0.000349 ***## nodefactor.Grade.10 2.55889 0.62167 0 4.116 < 1e-04 ***## nodefactor.Grade.11 2.30632 0.62423 0 3.695 0.000220 ***## nodefactor.Grade.12 2.93496 0.62202 0 4.718 < 1e-04 ***## nodematch.Sex 0.52444 0.13175 0 3.980 < 1e-04 ***## nodematch.Race.Black -Inf 0.00000 0 -Inf < 1e-04 ***## nodematch.Race.Hisp 0.57111 0.31521 0 1.812 0.070013 . ## nodematch.Race.NatAm 1.08712 0.30657 0 3.546 0.000391 ***## nodematch.Race.Other -Inf 0.00000 0 -Inf < 1e-04 ***## nodematch.Race.White 0.30392 0.62741 0 0.484 0.628101 ## nodematch.Grade.10 1.07180 0.53553 0 2.001 0.045352 * ## nodematch.Grade.11 1.83540 0.51002 0 3.599 0.000320 ***## nodematch.Grade.12 0.98219 0.57182 0 1.718 0.085858 . ## nodematch.Grade.7 6.01293 1.14975 0 5.230 < 1e-04 ***## nodematch.Grade.8 3.23593 0.64814 0 4.993 < 1e-04 ***## nodematch.Grade.9 1.62538 0.47664 0 3.410 0.000649 ***## gwesp 1.22643 0.12741 0 9.626 < 1e-04 ***## gwesp.decay 0.49816 0.12582 0 3.959 < 1e-04 ***## ---## Signif. codes: 0 '***' 0.001 '**' 0.01 '*' 0.05 '.' 0.1 ' ' 1## ## ## Warning: The following terms have infinite coefficient estimates:## nodematch.Race.Black nodematch.Race.OtherResults
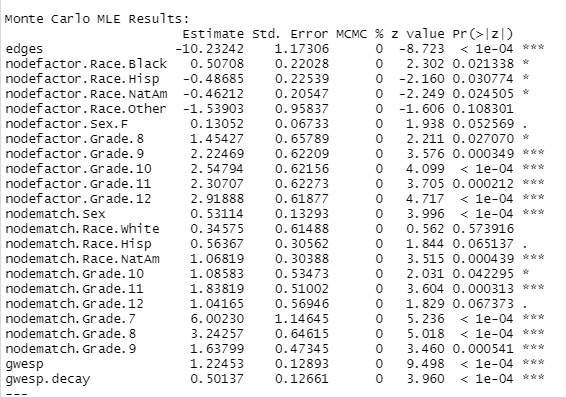
Summary of Results
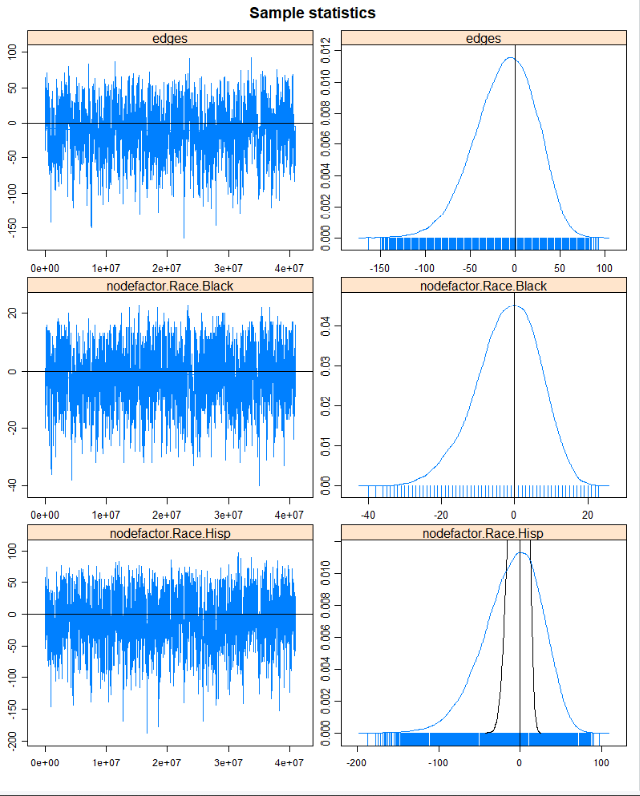
- Sociality increases by grade.
- Grade-based selective mixing is consistently assortative (i.e., the selective mixing coefficient is positive), but is strongest among 7th graders and declines with seniority.
- The triad closure (GWESP) coefficient is positive.
Interpreting GWESP coefficient
- Two nodes \(i\) and \(j\) have an edgewise shared partner when they are (1) connected to each other and (2) both \(i\) and j are also connected to a third individual \(k\).
- If \(i\) and \(j\) were also connected to node \(l\), then \(i\) and \(j\) would have two edgewise shared partners.
- When nodes have edgewise shared partnerships, they form triangles.
- The GWESP term models the tendency for ties that close triangles to be more likely than ties that do not close triangles.
- The GWESP term gradually decreases as pairs of individuals have more existing shared partners.
Interpreting GWESP coefficient
$$\begin{eqnarray} \omega=e^\alpha\sum\limits_{i=1}^{n-2}(1-(1-e^{-\alpha})^i)p_i, \end{eqnarray}$$
where \(\alpha\) is the decay parameter, \(p_i\) is the number of actor pairs who have exactly \(i\) shared edgewise partners, and \(n\) is the number of nodes in the network.
- The maximum number of edgewise-shared partners for any pair of nodes is \(n-2\).
Interpreting GWESP coefficient
Goal: calculate the change in GWESP statistic that will result from adding a particular tie.
Depends on (1) the number of triangles that the tie closes and (2) the existing number of edgewise shared partnerships that the nodes involved in the triangles already belong to.
- Adding a tie that closes no triangles has no effect on GWESP.
Adding a Tie That Closes One Triangle
Adding a tie that closes one triangle and no nodes in the group have any existing ESPs will:
add three ties with one edgewise shared partnership: \(1\) and \(2\) share partner \(3\), \(1\) and \(3\) share partner \(2\), and \(2\) and \(3\) share partner \(1\)
and remove two cases of a tie with zero shared partners: \(1-2\) and \(1-3\).

Adding a Tie That Closes One Triangle
- The corresponding change in the gwesp statistic for this toy network is:

- Assume the decay parameter, \(\alpha=.25\), then
exp(.25)*(1-(1-exp(-.25))^1)*3-exp(.25)*(1-(1-exp(-.25))^0)*2## [1] 3Consider a GWESP coefficient of \(1.8\).
If a tie will close one triangle, and all actor pairs in that triangle currently have no shared partners, the log-odds of the tie are increased by \(5.4\) (1.8*3), and the odds of such a tie are increased by \(exp(5.4)=\) 221.
Your Turn
- Suppose a tie closes one triangle, but nodes in the triangle to be closed already have some esps:
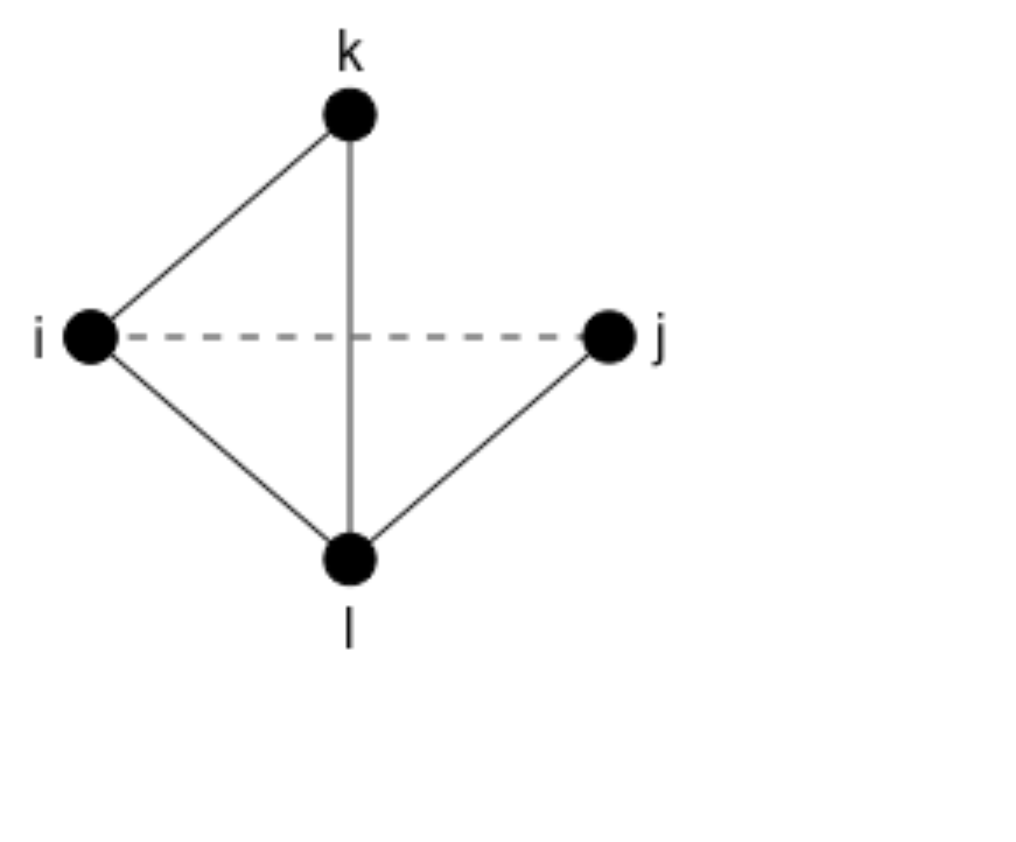
Calculate the change in the gwesp statistic that results from this change.
How many ties with one esps does this tie add? How many ties with two esps does this tie add?
Your Turn 2
- Remember this model we estimated on the Sampson monastery data. Calculate the probability of a non-reciprocated tie that closes one triangle among nodes with no esps and from different groups.
m2<-ergm(samplike~edges+mutual+nodematch('group')+gwesp(.25,fixed=TRUE))summary(m2)## Call:## ergm(formula = samplike ~ edges + mutual + nodematch("group") + ## gwesp(0.25, fixed = TRUE))## ## Monte Carlo Maximum Likelihood Results:## ## Estimate Std. Error MCMC % z value Pr(>|z|) ## edges -1.9339 0.3789 0 -5.104 < 1e-04 ***## mutual 1.3879 0.4798 0 2.892 0.00382 ** ## nodematch.group 2.2659 0.3900 0 5.810 < 1e-04 ***## gwesp.OTP.fixed.0.25 -0.2581 0.2164 0 -1.193 0.23298 ## ---## Signif. codes: 0 '***' 0.001 '**' 0.01 '*' 0.05 '.' 0.1 ' ' 1## ## Null Deviance: 424.2 on 306 degrees of freedom## Residual Deviance: 266.5 on 302 degrees of freedom## ## AIC: 274.5 BIC: 289.4 (Smaller is better. MC Std. Err. = 0.352)