Advanced Network Analysis
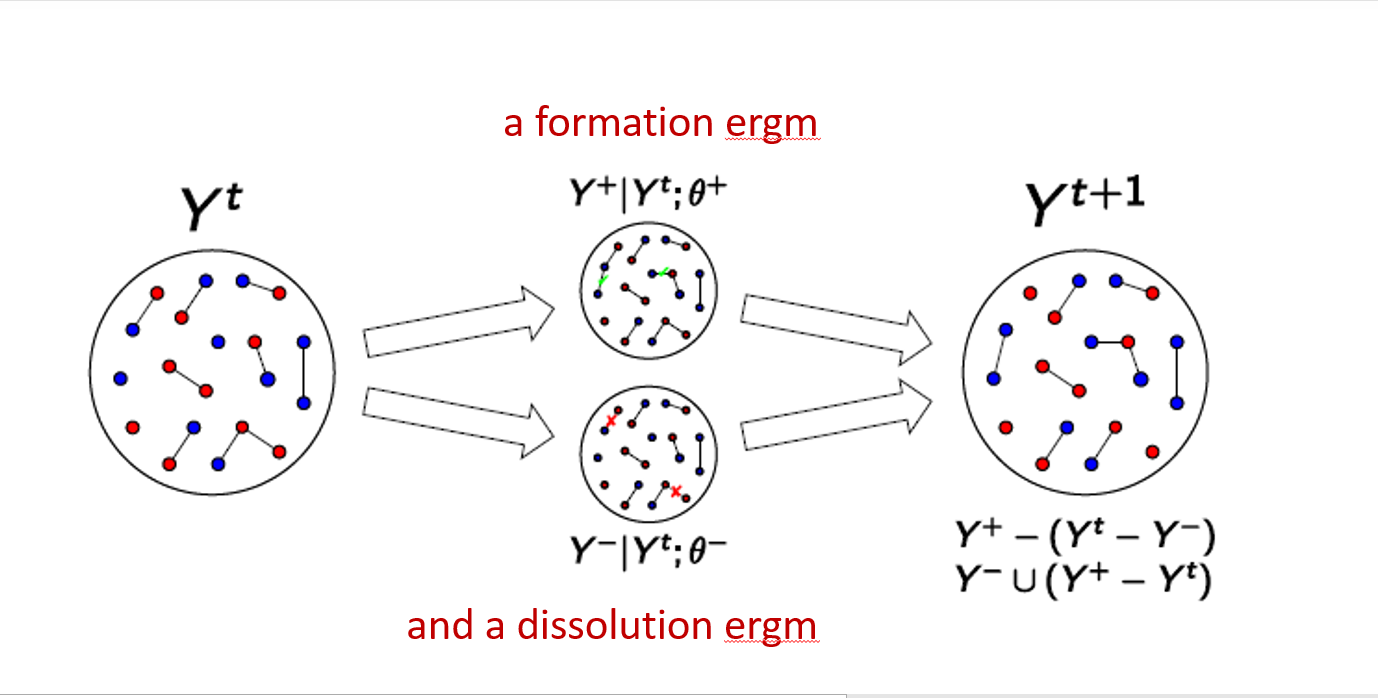
Temporal ERGMs
Shahryar Minhas [s7minhas.com]
Longitudinal networks
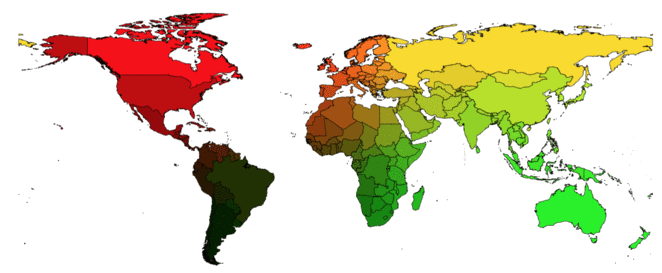
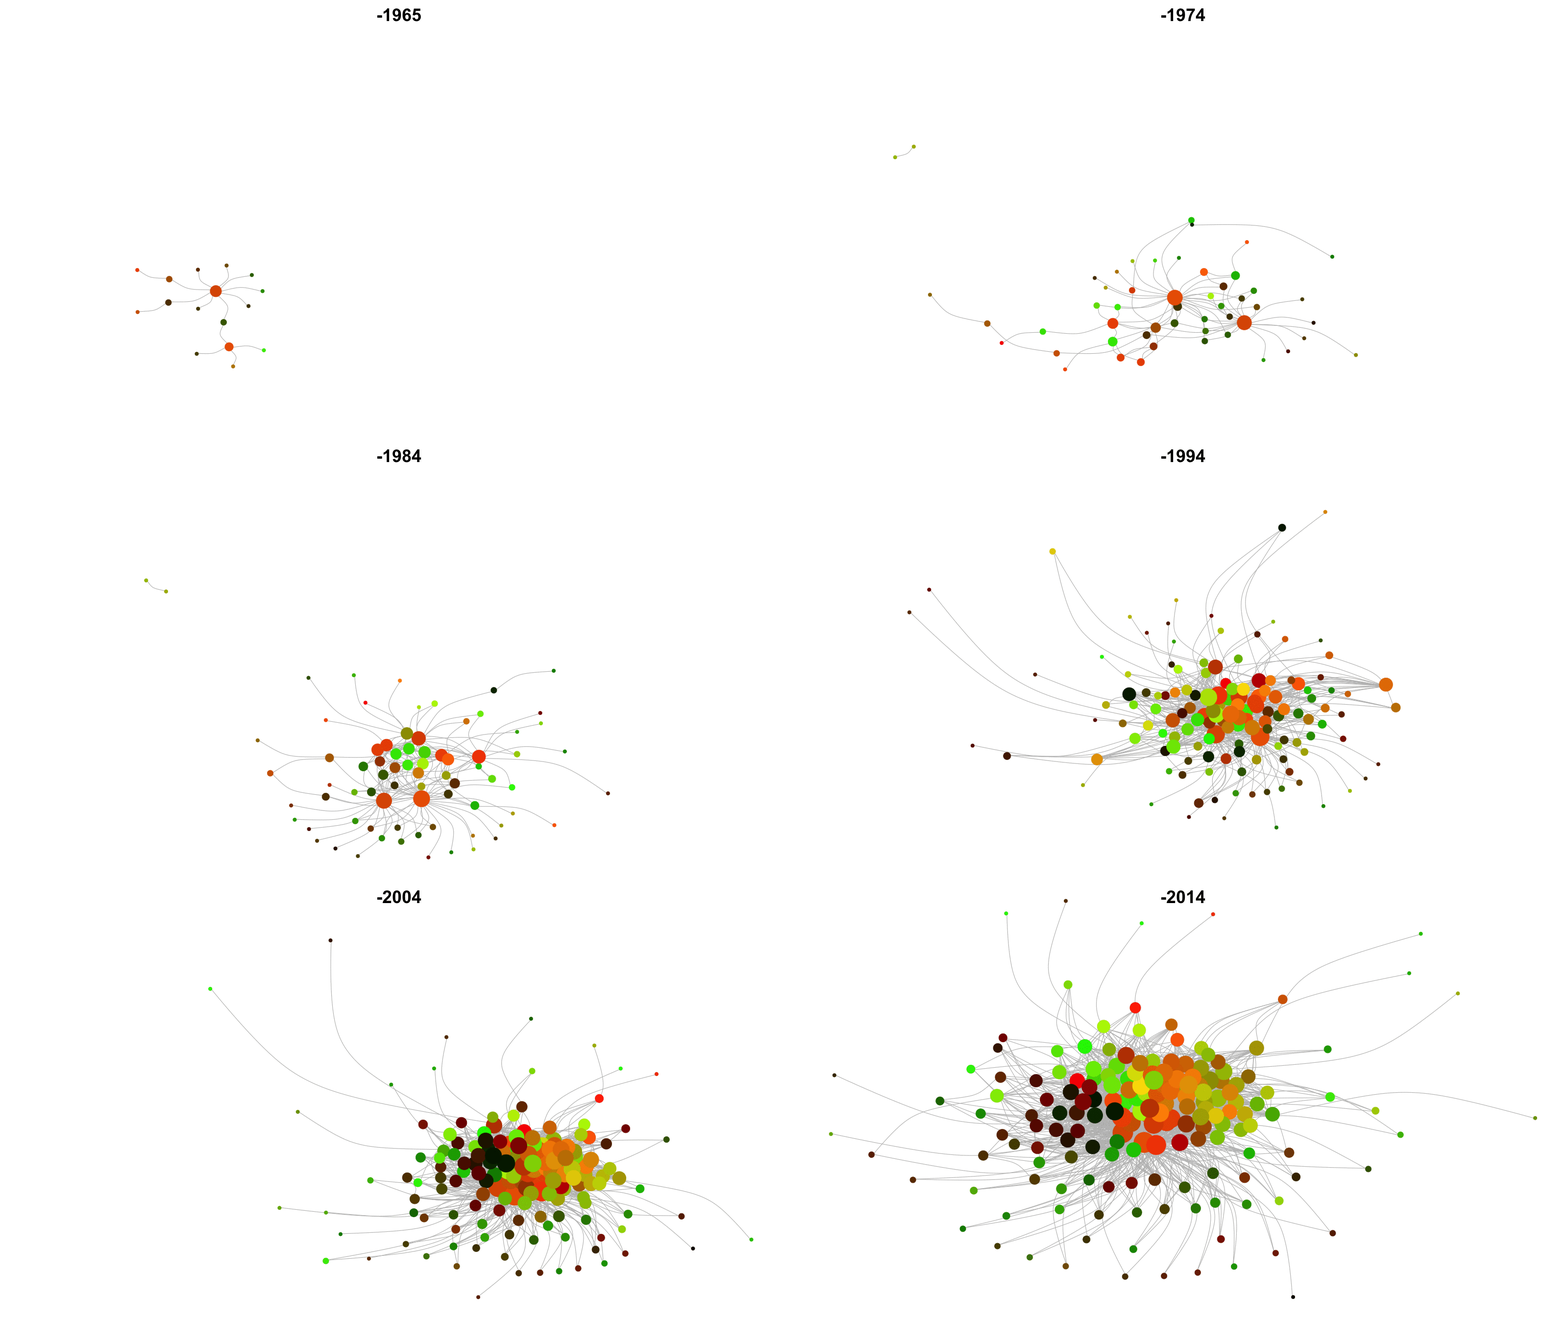
Longitudinal networks
Networks that change over time.
Examples: networks of friends, conflict networks, trade networks.
Want to model network dynamics within and across time periods.
Outline
Setting up longitudinal network data
Visualizing longitudinal data
Descriptive statistics
Inferential analysis
Getting the data ready
We are used to data in this format:
#install_github("ochyzh/networkdata")library(networkdata)data(allyData)head(dyadData)[,1:8]## cname1 cname2 year ally war contiguity id1_cinc id2_cinc## 2 CAN USA 1991 1 0 1 0.0119571 0.1364806## 3 MEX USA 1991 1 0 1 0.0125758 0.1364806## 4 COL USA 1991 1 0 0 0.0046681 0.1364806## 5 VEN USA 1991 1 0 0 0.0052502 0.1364806## 6 PER USA 1991 1 0 0 0.0033841 0.1364806## 7 BRA USA 1991 1 0 0 0.0240151 0.1364806Getting the data ready
We need to convert this information such that:
the dependent variable must be a
listofnetworkobjectsnodal covariates are vertex attributes in the
listofnetworkobjectsdyadic covariates are included separately in a
listofmatrices
Start with setting up war
Output should look like this:
class(war)## [1] "list"length(war)## [1] 10class(war[[1]])## [1] "matrix" "array"dim(war[[1]])## [1] 50 50war[[1]][1:3,1:3]## USA CHN IND## USA 0 0 0## CHN 0 0 1## IND 0 0 0contiguity should be easier
Output should look like this:
class(contiguity)## [1] "matrix" "array"dim(contiguity)## [1] 50 50contiguity[1:3,1:3]## USA CHN IND## USA 0 0 0## CHN 0 0 1## IND 0 1 0Now set up DV with vertex attributes
Output should look like this:
class(ally)## [1] "list"length(ally)## [1] 10class(ally[[1]])## [1] "network"list.vertex.attributes(ally[[1]])## [1] "cinc" "cname" "polity" "vertex.names" "year"TERGM: Discrete time model
Developed by Robins & Pattison (2001) and further developed by Hanneke et al. (2010)
Scholars in political science most notably Cranmer and Desmarais (2011) have eased the use and highlighted the utility of these types of models for political science
Extension of ERGM to the temporal setting is based on the idea of panel regression
In a sequence of observations, lagged earlier observations or derived information thereof can be used as predictors for later observations.
- In other words, some of the statistics are direct functions of an earlier realization of the network
- In its most basic form, the TERGM is a conditional ERGM with an earlier observation of the network occurring among the predictors.
TERGM: Discrete time model
- To extend ERGM to a longitudinal context, Hanneke et al. (2010) make a Markov assumption on the network from one time step to the next
- Specifically, given an observed network \(Y^{t}\), make the assumption that \(Y^{t}\) is independent of \(Y^{1}, \ldots, Y^{t-2}\)
- Thus a sequence of network observations has the property that:
\begin{align} Pr(Y^{2}, Y^{3}, \ldots, Y^{t} | Y^{1}) = Pr(Y^{t} | Y^{t-1}) Pr(Y^{t-1} | Y^{t-2}) \ldots Pr(Y^{2} | Y^{1}) \end{align}
TERGM: Discrete time model
- With this assumption in mind we just need to choose a form for the conditional PDF of \(P(Y^{t} | Y^{t-1})\)
- \(Y^{t} | Y^{t-1}\) can be expressed through an ERGM distribution, which then gives us what is referred to as a TERGM:
\begin{align} \Pr(Y^{t} | \theta, Y^{t-1}) &= \frac{ \exp( \theta^{T} g(Y^{t}, Y^{t-1}) ) }{ \mathcal{k} } \end{align}
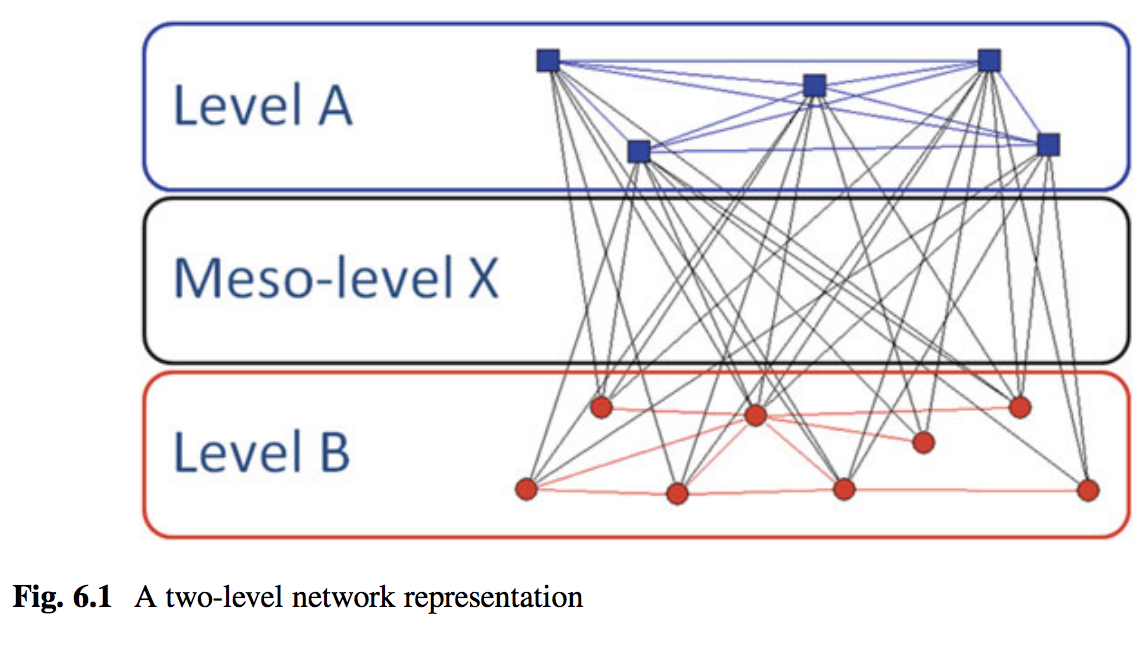
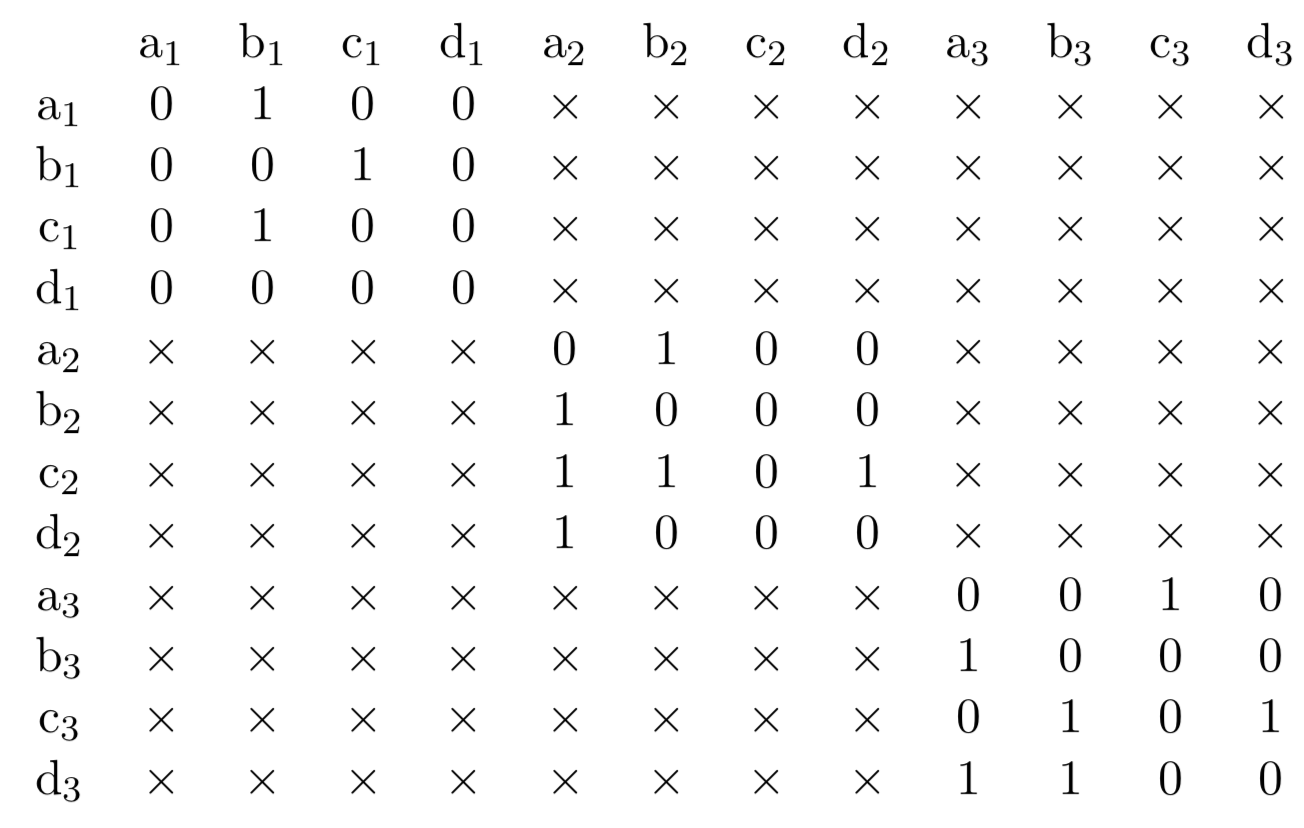
TERGM: Block-diag visualization
- TERGM is essentially estimated through an ERGM with the dependent variable modeled as a block-diagonal matrix (such as below)
- Constraints are put on the model such that cross-network edges in the off-diagonal blocks are prohibited
btergm Package
- The
btergmpackage has been developed by Leifeld, Cranmer, & Desmarais (2018) to estimate longitudinal networks using TERGM
- Package provides two functions to estimate a TERGM, one using a pseudolikelihood (
btergm) and the other using MCMC-MLE (mtergm)
Running a TERGM
- We are going to run a TERGM on the longitudinal alliance network, and will employ the following specification:
edges: density termedgecov(war): list of matrices where cross-sections denote waredgecov(contiguity): matrix of distances between countriesabsdiff(polity): Absolute difference between polity of \(i\) and \(j\)absdiff(cinc): Absolute difference between cinc of \(i\) and \(j\)gwesp(.5, fixed = TRUE): Geometric weighted triangle term
Running a TERGM
library(btergm)tergmFit <- btergm( ally ~ edges + edgecov(war) + edgecov(contiguity) + nodecov('polity') + absdiff("polity") + nodecov('cinc') + absdiff("cinc") + gwesp(.5, fixed = TRUE) )## t=1 t=2 t=3 t=4 t=5 t=6 t=7 t=8 t=9 t=10## ally (row) 50 50 50 50 50 50 50 50 50 50## ally (col) 50 50 50 50 50 50 50 50 50 50## war (row) 50 50 50 50 50 50 50 50 50 50## war (col) 50 50 50 50 50 50 50 50 50 50## contiguity (row) 50 50 50 50 50 50 50 50 50 50## contiguity (col) 50 50 50 50 50 50 50 50 50 50## t=1 t=2 t=3 t=4 t=5 t=6 t=7 t=8 t=9 t=10## maximum deleted nodes (row) 0 0 0 0 0 0 0 0 0 0## maximum deleted nodes (col) 0 0 0 0 0 0 0 0 0 0## remaining rows 50 50 50 50 50 50 50 50 50 50## remaining columns 50 50 50 50 50 50 50 50 50 50## t=1 t=2 t=3 t=4 t=5 t=6 t=7 t=8 t=9 t=10## ally (row) 50 50 50 50 50 50 50 50 50 50## ally (col) 50 50 50 50 50 50 50 50 50 50## war (row) 50 50 50 50 50 50 50 50 50 50## war (col) 50 50 50 50 50 50 50 50 50 50## contiguity (row) 50 50 50 50 50 50 50 50 50 50## contiguity (col) 50 50 50 50 50 50 50 50 50 50#check model fit:#GOF1<-gof(tergmFit)Results
summary(tergmFit)## Estimate Boot mean 2.5% 97.5%## edges -5.69586158 -5.70326749 -5.8470 -5.4967## edgecov.war[[i]] -0.07515258 -0.06963466 -0.3202 0.1405## edgecov.contiguity[[i]] 2.54540447 2.54655506 2.4927 2.6226## nodecov.polity -0.00027339 -0.00011494 -0.0062 0.0056## absdiff.polity 0.01865488 0.01880566 0.0142 0.0232## nodecov.cinc -1.42023487 -1.44550741 -2.0620 -0.8232## absdiff.cinc 26.96999913 27.03209595 26.2319 27.8021## gwesp.fixed.0.5 2.24553096 2.24844146 2.1292 2.3447Temporal Terms
delrecip(mutuality = FALSE, lag = 1): checks for delayed reciprocity. For example, if node \(j\) is tied to node \(i\) at \(t = 1\), does this lead to a reciprocation of that tie back from \(i\) to \(j\) at \(t = 2\)? If mutuality = TRUE is set, this extends not only to ties, but also non-ties. The lag argument controls the size of the temporal lag: with \(lag = 1\), reciprocity over one consecutive time period is checked. Note that as lag increases, the number of time steps on the dependent variable decreases.memory(type = "stability", lag = 1): controls for the impact of a previous network on the current network. Four different types of memory terms are available: positive autoregression (type = "autoregression") checks whether previous ties are carried over to the current network; dyadic stability (type = "stability") checks whether both edges and non-edges are stable between the previous and the current network; edge loss (type = "loss") checks whether ties in the previous network have been dissolved and no longer exist in the current network; and edge innovation (type = "innovation") checks whether previously unconnected nodes have the tendency to become tied in the current network.
Temporal Terms Cont'd
timecov(x = NULL, minimum = 1, maximum = NULL, transform = function(t) t): checks for linear or non-linear time trends with regard to edge formation. Optionally, this can be combined with a covariate to create an interaction effect between a dyadic covariate and time in order to test whether the importance of a covariate increases or decreases over time. In the default case, edges modeled as being linearly increasingly important over time. By tweaking the transform function, arbitrary functional forms of time can be tested. For example, transform = sqrt (for a geometrically decreasing time effect), transform = function(x) x^2 (for a geometrically increasing time effect), transform = function(t) t (for a linear time trend) or polynomial functional forms (e.g., 0 + (1 t) + (1 t^2)) can be used.
tergmFit1 <- btergm(ally ~ edges + edgecov(war) + edgecov(contiguity) + nodecov('polity') + absdiff("polity") + nodecov('cinc') + absdiff("cinc") + gwesp(.5, fixed = TRUE)+ timecov())summary(tergmFit1)Duque (2018)
The DV is diplomatic ties, dipl_ties:
#Clear your memory and unload `btergm` as it clashes with `network`:detach("package:btergm", unload=TRUE)data("duqueData")class(dipl_ties)## [1] "list"length(dipl_ties)## [1] 8class(dipl_ties[[1]])## [1] "data.frame"The Dependent Variable
we can see that dipl_ties is currently a list of data.frames. Let's convert it into a list of networks.
library(statnet)for (i in 1:8) {dipl_ties[[i]]<-as.network(as.matrix(dipl_ties[[i]]))}class(dipl_ties[[1]])## [1] "network"Duque (2018)
Popularity hypothesis: High-status states should receive more recognition simply because of their position in the
social structure, rather than because of the possession of status attributes (2-instars).
Reciprocity and transitivity: A state’s existing relations should influence the state’s ability to achieve status (mutual and triangle).
Homophily: States should recognize states that have similar values and resources as them (absdiff).
Dyadic Covariates
Contiguity (contig) and alliances (allies) are time-varying edge-level covariates. We must make sure that they are stored as lists of matrices.
#Contiguity:class(contig)## [1] "list"length(contig)## [1] 8class(contig[[1]])## [1] "data.frame"dim(contig[[1]])## [1] 134 134contig[[1]][1:3,1:3]## 2 20 40## 2 0 1 0## 20 1 0 0## 40 0 0 0Allies
#Allies:class(allies)## [1] "list"length(allies)## [1] 8class(allies[[1]])## [1] "data.frame"dim(allies[[1]])## [1] 134 134allies[[1]][1:3,1:3]## 2 20 40## 2 0 1 0## 20 1 0 0## 40 0 0 0Dyadic Covariates
It looks like allies and contig are currently stored as lists of data.frames. We must convert them to lists of matrices.
for (i in 1:8) {contig[[i]]<-as.matrix(contig[[i]])allies[[i]]<-as.matrix(allies[[i]])}Now set up DV with vertex and dyadic attributes
Our node-level covariate, polity$dem_dum must be defined as a vertex attribute in each of the dipl_ties networks.
#Define Dem as a vertex attribute for each year of dipl_ties (didn't work as a loop): set.vertex.attribute(dipl_ties[[1]],"dem",polity$dem_dum[polity$year==1970]) set.vertex.attribute(dipl_ties[[2]],"dem",polity$dem_dum[polity$year==1975]) set.vertex.attribute(dipl_ties[[3]],"dem",polity$dem_dum[polity$year==1980]) set.vertex.attribute(dipl_ties[[4]],"dem",polity$dem_dum[polity$year==1985]) set.vertex.attribute(dipl_ties[[5]],"dem",polity$dem_dum[polity$year==1990]) set.vertex.attribute(dipl_ties[[6]],"dem",polity$dem_dum[polity$year==1995]) set.vertex.attribute(dipl_ties[[7]],"dem",polity$dem_dum[polity$year==2000]) set.vertex.attribute(dipl_ties[[8]],"dem",polity$dem_dum[polity$year==2005])dipl_ties[[1]] %v% "dem"## [1] 1 1 0 0 0 1 0 0 0 0 0 0 0 1 0 1 1 0 0 0 0 0 0 0 0 1 1 1 1 1 1 1 1 0 0 1 0## [38] 0 1 0 0 1 0 0 0 0 1 0 0 0 1 1 1 1 0 0 1 0 0 0 0 0 0 0 0 0 0 0 0 0 0 0 0 0## [75] 0 0 0 0 0 0 0 0 0 0 0 0 0 0 0 0 1 0 0 0 0 0 0 1 0 0 0 0 0 1 0 0 0 0 0 0 0## [112] 0 0 0 1 1 0 0 0 1 0 0 0 0 0 0 0 0 0 0 0 1 1 0dipl_ties[[2]] %v% "dem"## [1] 1 1 0 0 0 0 1 0 0 0 0 0 0 0 0 1 0 1 1 0 0 0 0 0 0 0 0 0 1 1 1 1 1 1 1 0 0## [38] 1 0 0 1 0 0 1 0 0 0 1 1 0 0 0 1 1 1 1 0 0 0 1 0 0 0 0 0 0 0 0 0 0 0 0 0 0## [75] 0 0 0 0 0 0 0 0 0 0 0 0 0 0 0 0 0 0 0 0 0 0 0 1 0 0 0 0 0 0 1 0 0 0 0 0 1## [112] 0 0 0 0 0 0 0 0 0 0 0 0 0 0 1 0 0 1 0 0 1 0 0 0 0 0 0 0 0 0 0 0 1 0 1 0 0Specify the Model:
library(btergm)#This runs for 5 min:tergm_Duque<-btergm(dipl_ties ~ edges + istar(2) + ostar(2) + mutual + triangles+ absdiff("dem")+ +nodeicov("dem")+ +edgecov(allies) +edgecov(contig), R=1000)summary(tergm_Duque)Run the Model
## Estimate Boot mean 2.5% 97.5%## edges -5.377882 -5.405644 -5.6133 -5.1253## istar2 0.028279 0.028712 0.0267 0.0313## ostar2 0.029487 0.030022 0.0266 0.0340## mutual 2.485567 2.482407 2.3500 2.5956## triangle 0.011750 0.011628 0.0103 0.0127## absdiff.dem -0.287938 -0.289257 -0.3656 -0.2207## nodeicov.dem -0.204423 -0.195365 -0.2515 -0.1246## edgecov.allies[[i]] 1.205762 1.220685 1.1238 1.3205## edgecov.contig[[i]] 1.765076 1.765720 1.5732 2.0623Results
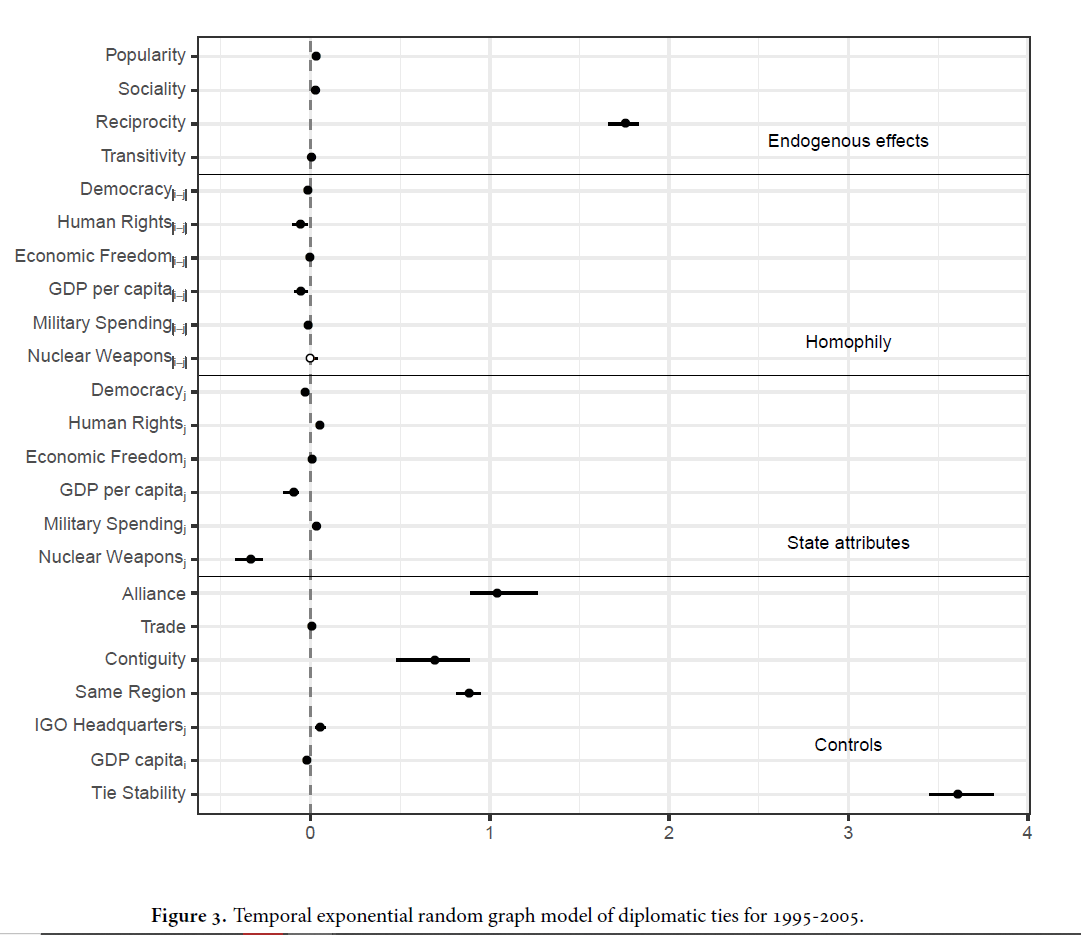
Example with Time Vars
#This runs for 5 min:tergm_Duque1<-btergm(dipl_ties ~ edges + istar(2) + ostar(2) + mutual + triangles+ absdiff("dem")+ +nodeicov("dem")+ +edgecov(allies)+ +edgecov(contig)+ timecov(), R=1000)summary(tergm_Duque1)Example with Time Vars
## Estimate Boot mean 2.5% 97.5%## edges -4.915580 -4.944023 -5.2673 -4.5906## istar2 0.029973 0.030279 0.0283 0.0333## ostar2 0.031485 0.031775 0.0289 0.0353## mutual 2.428539 2.424032 2.2767 2.5464## triangle 0.011518 0.011492 0.0102 0.0126## absdiff.dem -0.298055 -0.300189 -0.3669 -0.2392## nodeicov.dem -0.122282 -0.130947 -0.2013 -0.0506## edgecov.allies[[i]] 1.199983 1.217104 1.0998 1.3312## edgecov.contig[[i]] 1.837357 1.828172 1.6100 2.1092## edgecov.timecov1[[i]] -0.126189 -0.127274 -0.2050 -0.0802